- Home >
- Stock Photos >
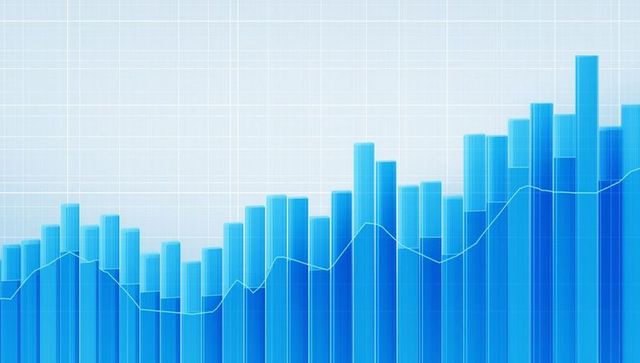
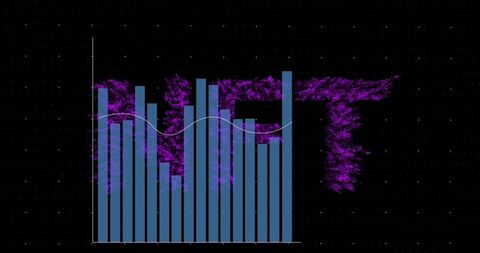
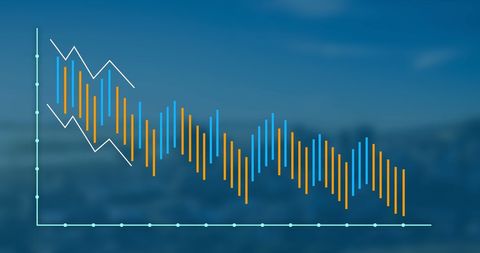
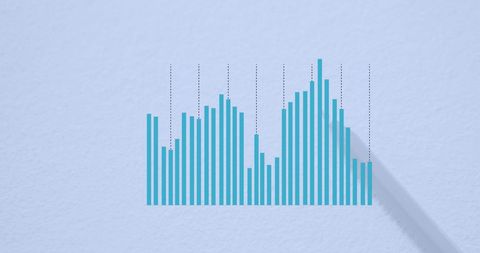
- Visual Data Charts Representing Financial Analytics
Visual Data Charts Representing Financial Analytics Image

Bar and line graphs designed for illustrating financial data trends. Useful for educational or business presentations focused on global financial analysis, investment scenarios, or economy studies.

downloads
Tags:
More
Credit Photo
If you would like to credit the Photo, here are some ways you can do so
Text Link
photo Link
<span class="text-link">
<span>
<a target="_blank" href=https://pikwizard.com/photo/visual-data-charts-representing-financial-analytics/06a6374f9dc5f033fe8af5fb6e7c361d/>PikWizard</a>
</span>
</span>
<span class="image-link">
<span
style="margin: 0 0 20px 0; display: inline-block; vertical-align: middle; width: 100%;"
>
<a
target="_blank"
href="https://pikwizard.com/photo/visual-data-charts-representing-financial-analytics/06a6374f9dc5f033fe8af5fb6e7c361d/"
style="text-decoration: none; font-size: 10px; margin: 0;"
>
<img src="https://pikwizard.com/pw/medium/06a6374f9dc5f033fe8af5fb6e7c361d.jpg" style="margin: 0; width: 100%;" alt="" />
<p style="font-size: 12px; margin: 0;">PikWizard</p>
</a>
</span>
</span>
Free (free of charge)
Free for personal and commercial use.
Author: Authentic Images