- Home >
- Stock Photos >
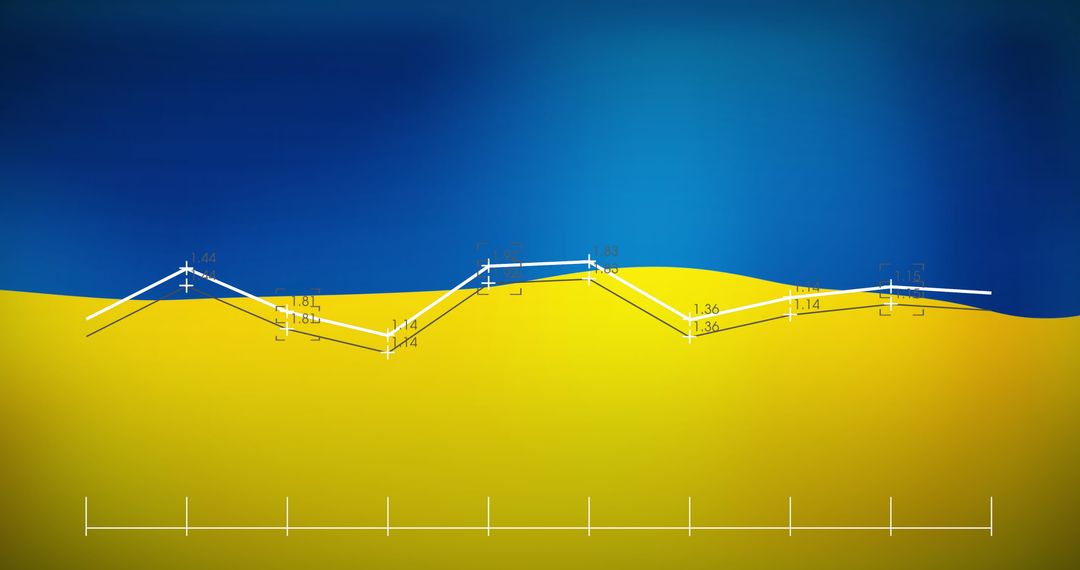
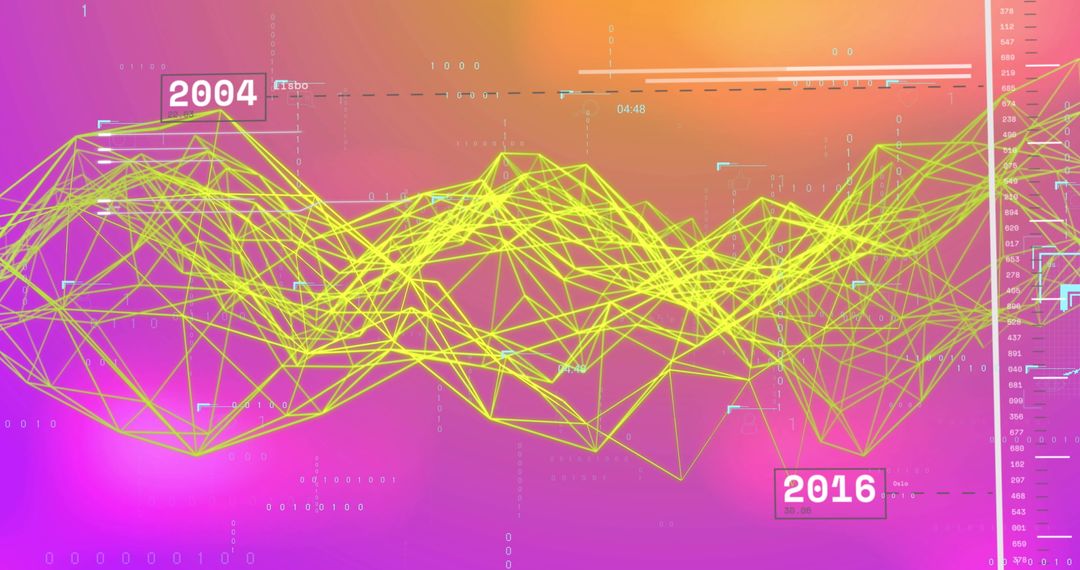
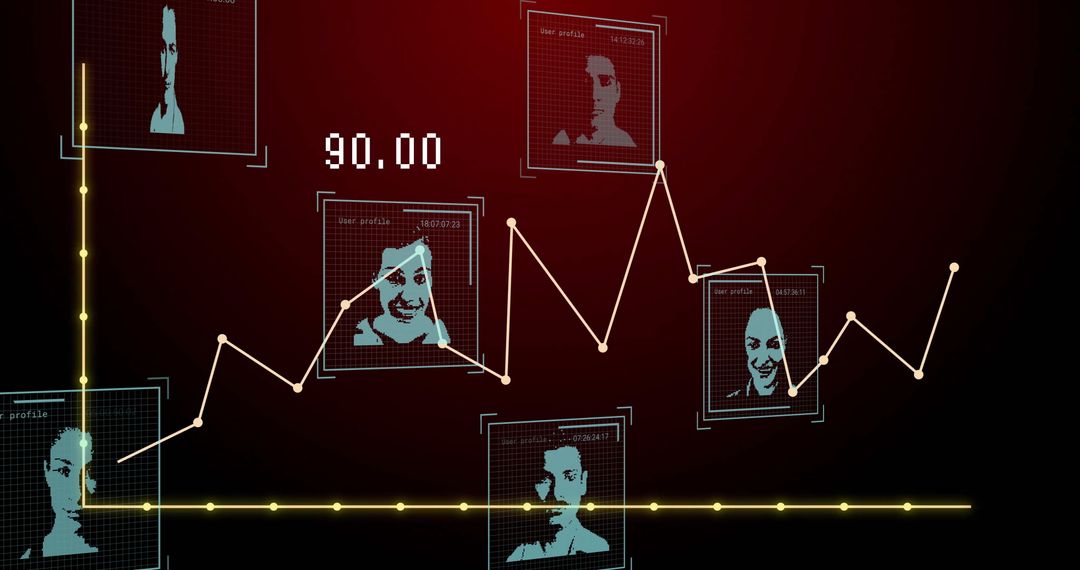
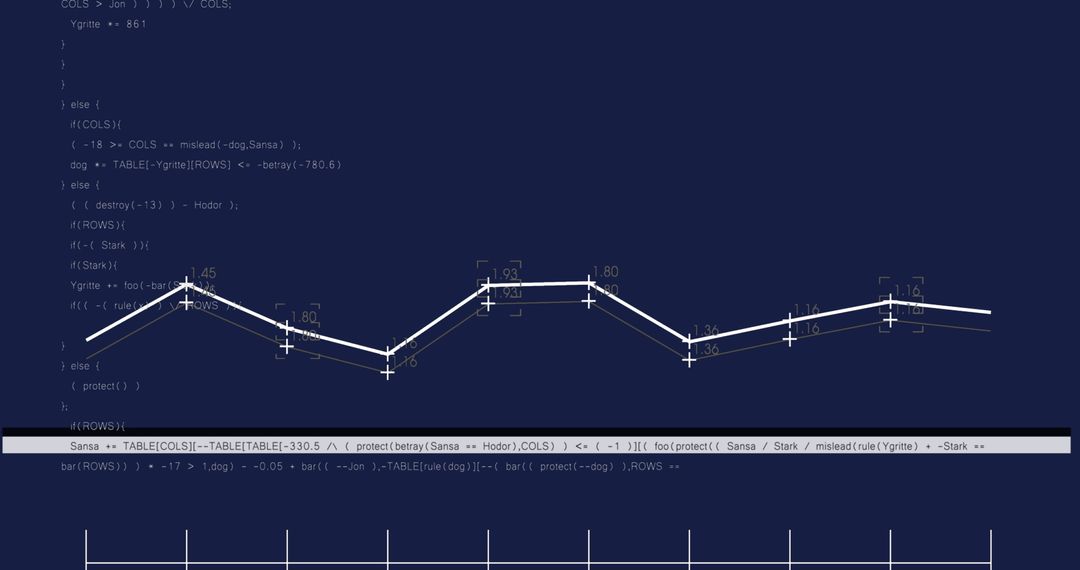
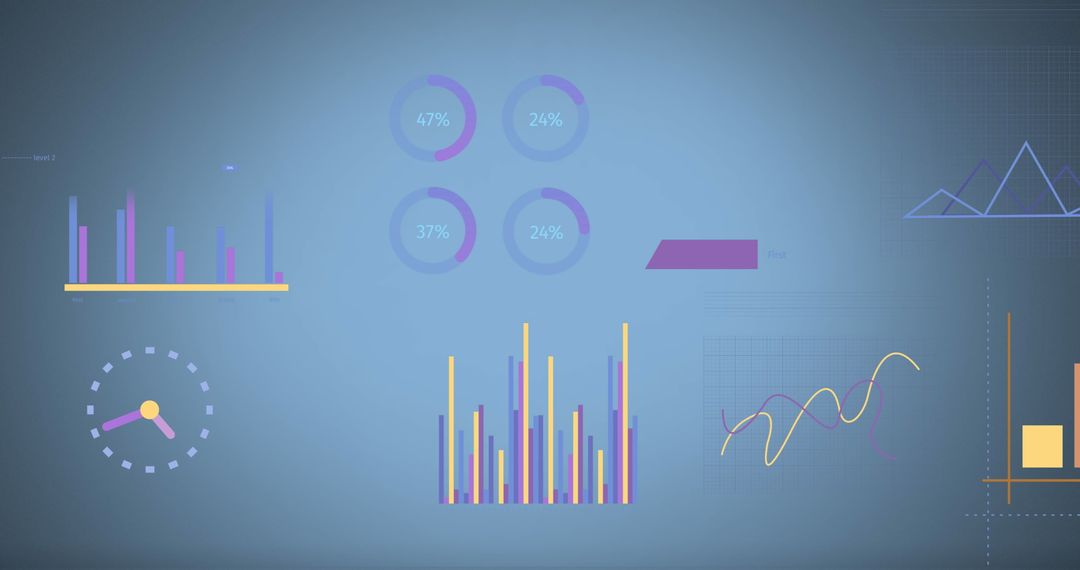
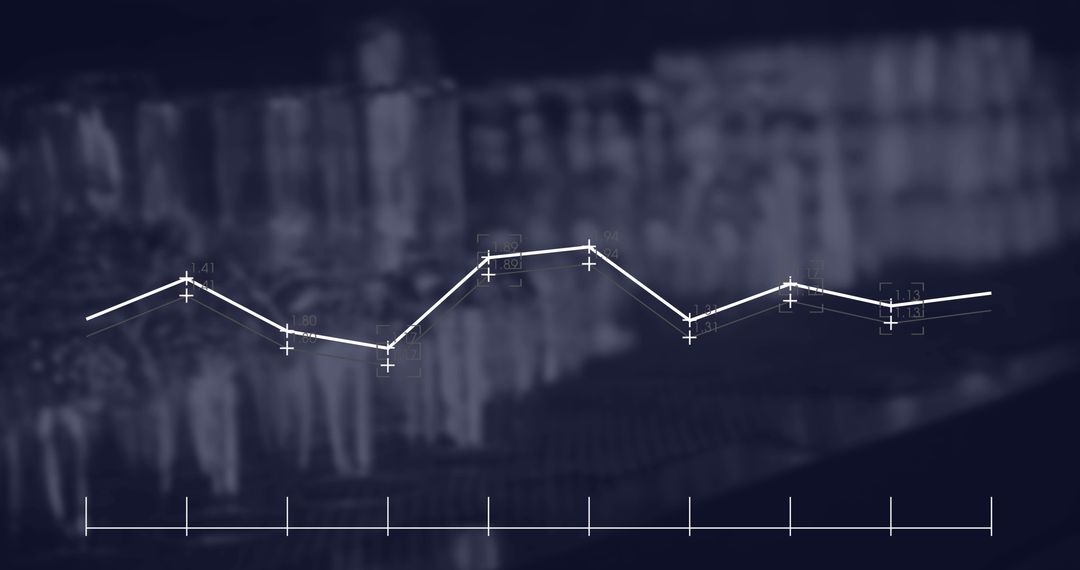
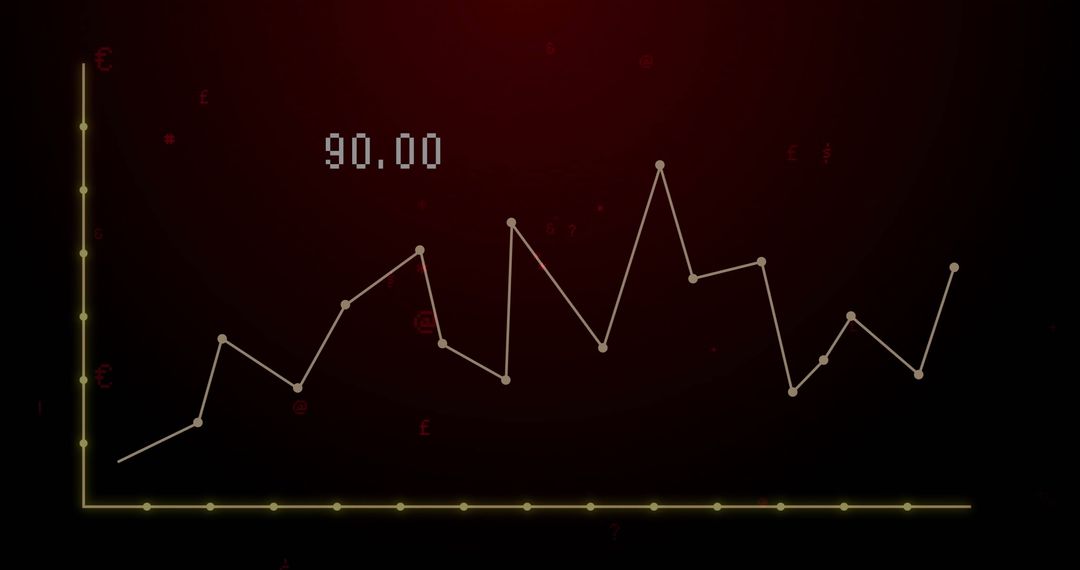
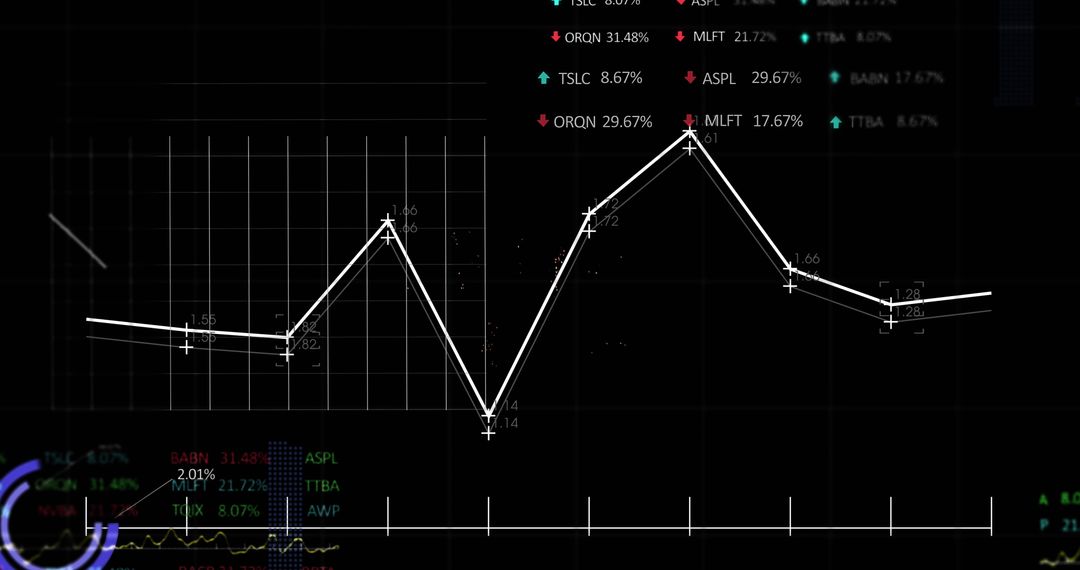
- Visual Infographic of Statistical Data Analysis on Vibrant Orange Background
Visual Infographic of Statistical Data Analysis on Vibrant Orange Background Image
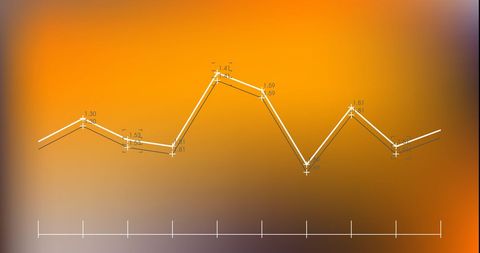
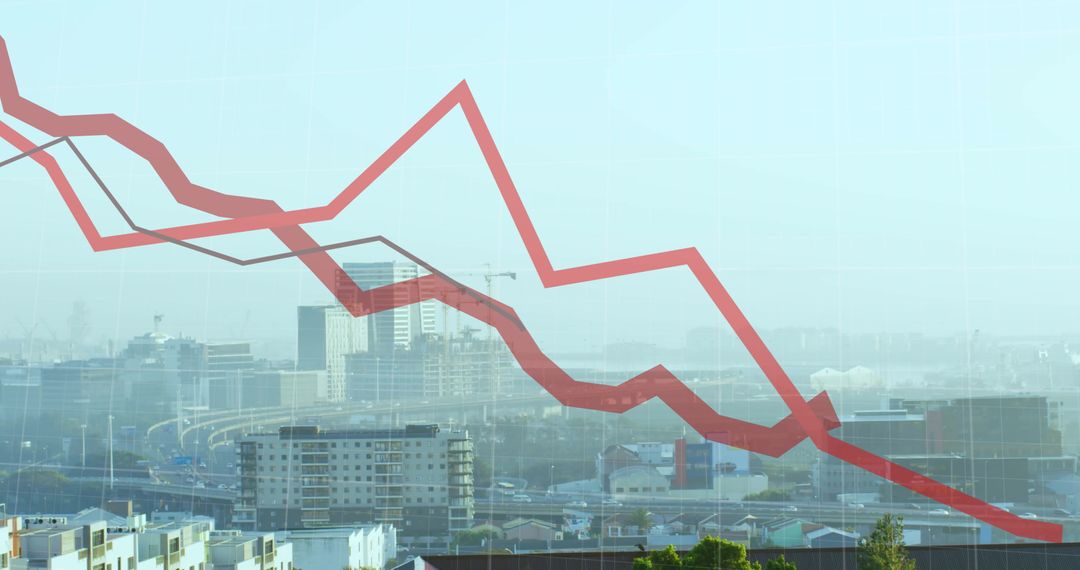
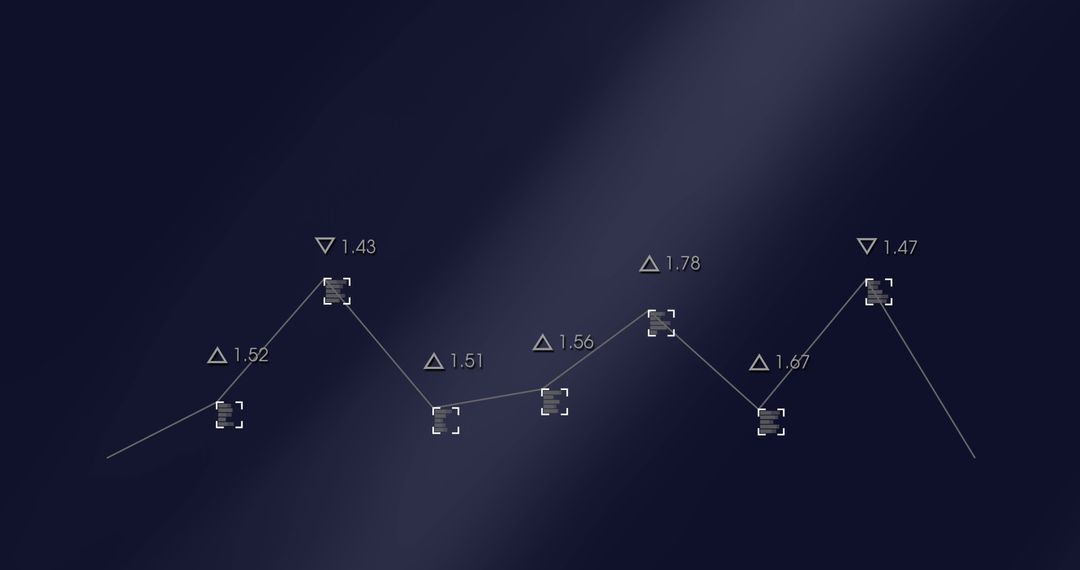
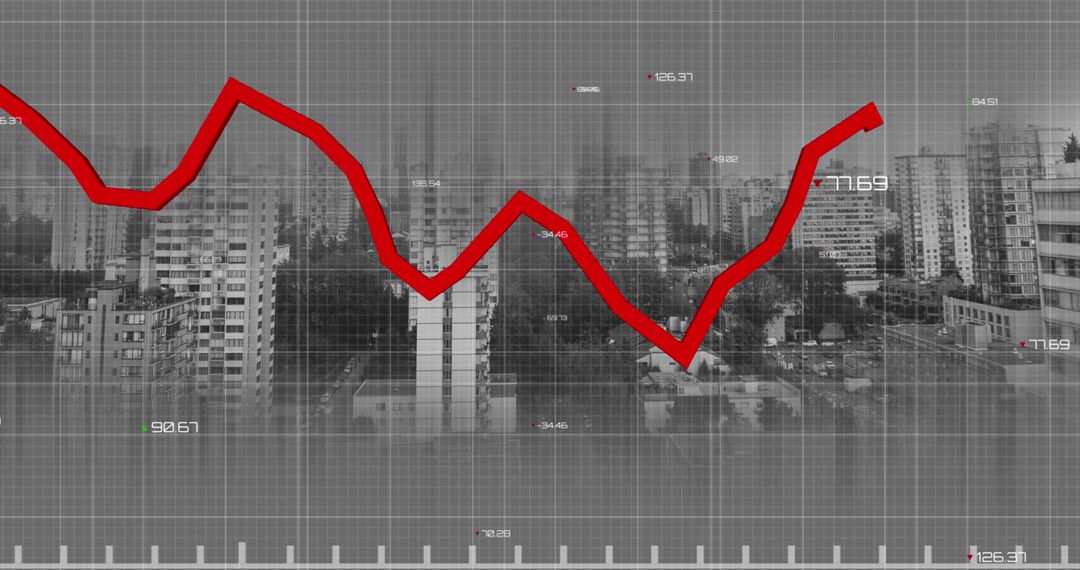
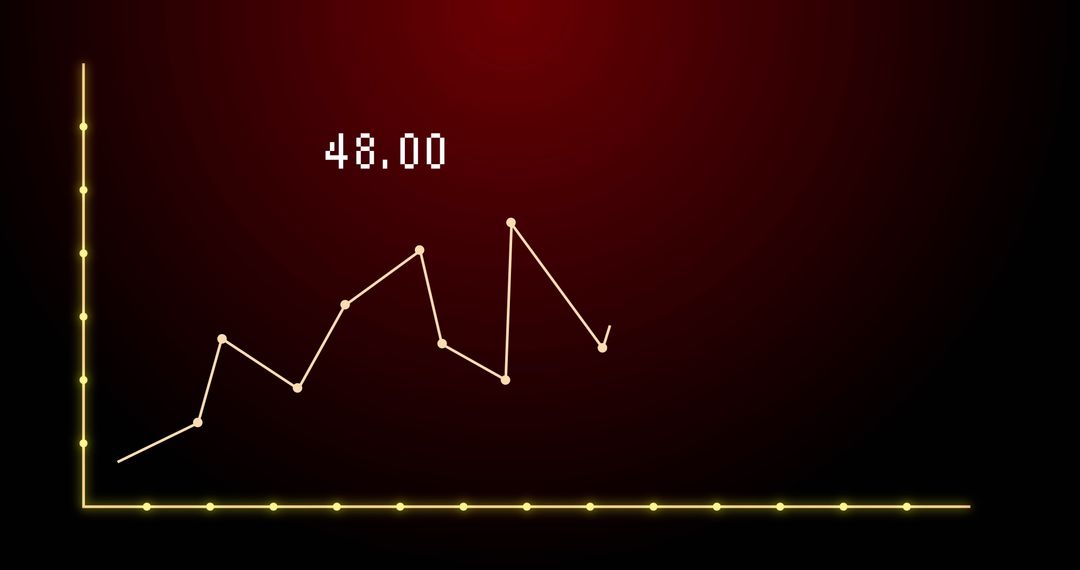
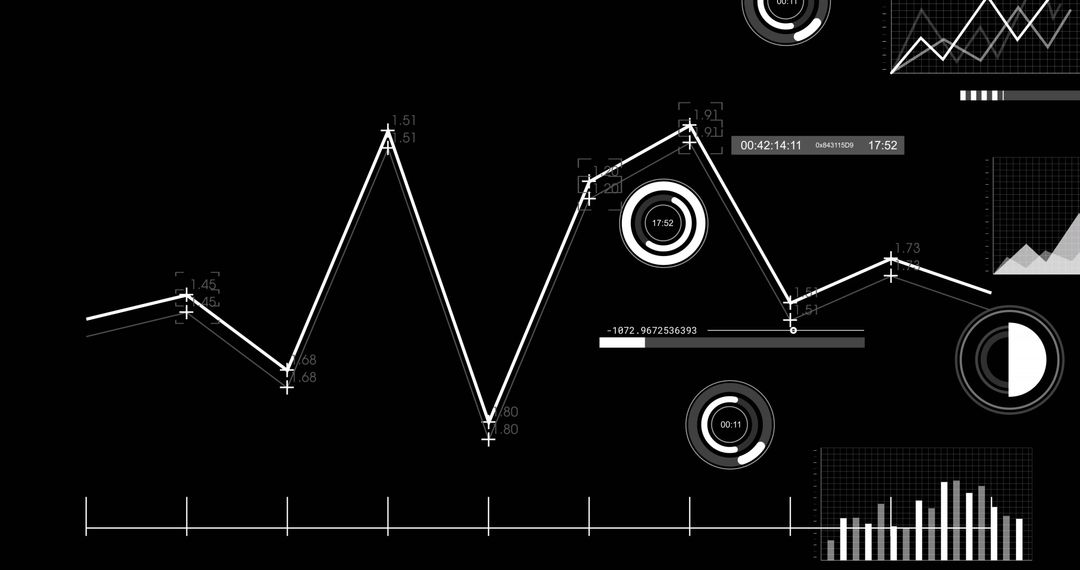
Dynamic visual showing statistical analysis with a digital graph overlay on an orange background. Ideal for representing analytics, business intelligence, financial data insights, and educational purposes about data processing and analysis.
Powered by  - Get 15% off with code: PIKWIZARD15


2
downloads
downloads
Tags:
More
Credit Photo
If you would like to credit the Photo, here are some ways you can do so
Text Link
photo Link
<span class="text-link">
<span>
<a target="_blank" href=https://pikwizard.com/photo/visual-infographic-of-statistical-data-analysis-on-vibrant-orange-background/83c67e14edb801ea35633787eb367dc0/>PikWizard</a>
</span>
</span>
<span class="image-link">
<span
style="margin: 0 0 20px 0; display: inline-block; vertical-align: middle; width: 100%;"
>
<a
target="_blank"
href="https://pikwizard.com/photo/visual-infographic-of-statistical-data-analysis-on-vibrant-orange-background/83c67e14edb801ea35633787eb367dc0/"
style="text-decoration: none; font-size: 10px; margin: 0;"
>
<img src="https://pikwizard.com/pw/medium/83c67e14edb801ea35633787eb367dc0.jpg" style="margin: 0; width: 100%;" alt="" />
<p style="font-size: 12px; margin: 0;">PikWizard</p>
</a>
</span>
</span>
Free (free of charge)
Free for personal and commercial use.
Author: Awesome Content
Similar Free Stock Images

Premium


Premium


Premium


Premium


Premium


Premium


Premium


Premium


Premium


Premium


Premium


Premium


Premium


Premium


Premium


Premium


Premium


Premium


Premium


Premium


Premium


Premium


Premium


Premium