1. Home > 
  2. Stock Photos > 
  3. Visualized Digital Data Processing on Dark Background

Visualized Digital Data Processing on Dark Background Image

Visualized Digital Data Processing on Dark Background

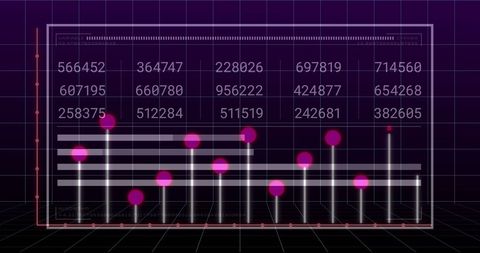
An abstract representation of digital data processing set against a dark background, highlighting global finance and data connections. The vivid pink points along horizontal grids symbolize data interaction points, making it a striking portrayal of cloud computing techniques. Ideal for illustrating modern data analytics concepts, tech presentations, finance or technology articles, and digital interfaces.

Powered by Adobe logo
Person typing on a laptop representing document workflow from signature to approval with a green checkmark. - Powered by AdobeFuturistic digital interface overlaying a cityscape, showcasing data visualization and global connections. - Powered by AdobeThis image illustrates a digital financial growth chart over a keyboard, symbolizing business trends, market analysis, and technological advancements in the finance sector. Copula - Powered by AdobeBusiness analysis reports with charts and graphs. Integrated content management platform. Digital document automation. Businessperson holding reports. - Powered by AdobeVibrant digital data stream and analytics visualization with glowing blue and pink waves, representing modern technology and connectivity. generative ai - Powered by Adobe

Credit Photo

If you would like to credit the Photo, here are some ways you can do so

Free (free of charge)

Free for personal and commercial use.

Author: People Creations

Similar Free Stock Images

Financial Data Processing Over Digital Interface and Graphs
Premium
Vibrant workspace showcasing data analysis with colorful charts and graphs on a large digital dashboard display
Green Line Chart Overlay on Dark Financial Data Background
Dynamic Financial Data Analysis with Growth Indicators
Dynamic Red Line Graph on Digital Data Grid Background
Abstract Data Visualization with Bar and Line Graphs on Network Grid
Futuristic Financial Data with Digital Interface
Digital Interface Displaying Volatile Financial Market Analysis
Premium
AI Data Processing on Laptop Photo
Futuristic Neon Data Graph on Digital Grid
Digital Stock Market Analysis with Graphs and Charts
Declining Graph with 49% Reduction on Dark Digital Background
Innovative Digital Finance Data Display on Dark Interface
Dynamic Financial Chart with Red Line Graph on Digital Interface
Financial Chart with Dynamic Numbers on Grid Background
Digital Data Analysis Against Abstract Cityscape
Digital Stock Market Data and Trends Visualization
Green Line Chart with Financial Data on Digital Display
Digital Financial Data Graph on Black Screen Background
Digital Financial Data Overlaid on City Lights Background
Cybersecurity Dashboard With Data and Code Elements Display
Futuristic Graph Showing Financial Growth with Neon Highlights
Premium
Worldwide digital payment network showing secure financial transactions. Digital payment supports transfer, digital payment ensures security, boosts convenience, drives global finance. Latch
Fluctuating Financial Graph With Data Visualization
Colorful Candlestick Chart on Trading Interface
Dynamic Financial Data with Red Line on Digital Interface
Green Financial Line Graph with Candlestick Data on Grid Background
Visualizing social engagement trends with dashboard analytics and real-time insights
Abstract Financial Data Processing on Black Background
Digital Financial Chart and Global Currency Symbols on Blue Background
Financial Growth Chart with Dynamic Green Line on Grid Overlay
Premium
Glass digital chain concept shows security structure with data processing and technology
Green Data Graph on Black Digital Interface
Financial Data Visualization with Global Network Elements
Digital Financial Analysis with Infographic and Data Flow
Fluctuating Financial Graph on Green Grid Background
Red Line Graph Over Histogram Representing Financial Volatility
Abstract Digital Data with Upward Trending Line Graph
Premium
Businessman managing invoices with laptop, modern technology for efficient accounting and finance
Premium
Confident businessman interacts with futuristic interface, pressing digital button labeled REQUEST, accessing communication and data icons for seamless workflow.
Economic Trends Analysis with Financial Indicators and Graphs
Dynamic Stock Market Trends and Financial Data Graph
Displaying Financial Dashboard with Candlestick Charts, Trend Lines and Economic Icons
Futuristic Digital Graph with Glitch Effect for Data Analysis
Premium
KYC digital verification concept with mobile banking interface, identity authentication, fintech compliance, secure customer onboarding, AML regulation, data protection and online financial security.
Premium
Businesswoman working on laptop with analytics graphs displayed on screen inside warehouse. Concept of logistics, supply chain, inventory management, shipping, ecommerce and distribution.
Financial Data Analysis with Interactive Graphs
Dynamic Financial Graph with Changeable Metrics Over Green Line
Premium
Businessperson using digital smartphone and laptop to manage global tax system. Concept of online tax filing, financial technology, remote accounting software and international taxation management.
Global Financial Data and Stock Market Trends on World Map
Dynamic Stock Market Graphs with Trends and Data Alerts
Rising Stock Market Trends and Chart Analysis
Dynamic Stock Market Data with Fluctuating Graph
Premium
Modern Laptop with Holographic Interface and User Interaction, Efficient Workflow Management on a Sleek Laptop with Digital Icons
Digital Hologram with Dynamic Numbers on Graph Grid
Digital Grid Interface with Data Points for Business Analysis
Digital Financial Data Analytics and Economic Trends
Analytics Dashboard with Dynamic Financial Graphs and Data
Premium
Secure financial payment processing illustration with a credit card and NFC terminal, representing modern digital transactions and fintech technology.
Premium
Organizational structure and business development concept with wooden blocks forming a growth chart linked to a digital data network
Futuristic Graph and Data Visualization Interface Design
Dynamic Digital Stock Market Chart with Growing Financial Trends
Data Analysis Process with Green Digital Interface
Digital Financial Data Analysis with Infographics and Charts
Diverse Graphical Data on Digital Financial Interface Concept
Premium
Digital procurement process technology interface with data icons and businessman typing on laptop, representing supply chain management concept.
Premium
Businessman manage digital procurement process with business contract, invoice, approval documents, representing B2B sourcing, vendor management, supply chain, e-procurement.
Premium
Abstract tech illustration of digital data flow and processing with lines and dots. Concept of AI blockchain network system and financial transactions shown.
Digital Financial Graphs and Data Analysis Visualization
Digital Data Visualization on Grid Display
Dynamic Financial Data Analysis with Virtual Screen
Financial Graph Showing Indices Trends on Blue Background
Premium
Two individuals manage digital documents and data streams using an innovative interactive virtual interface.
Digital Abstract Graph Showing Financial Growth and Currency Analysis
High-Tech Financial Data Analysis Display with Graphs
Digital Analytics Interface with Data Trends and Performance Metrics
Abstract Cityscape with Blue and Pink Data Graphs Overlay
Premium
A person holding a credit card and smartphone with a digital payment interface overlayed, symbolizing secure online transactions.
Dynamic Financial Graphs Illustrating Market Trends
Dynamic Red Line Graph With Data Points on Gridded Background
Dynamic Financial Data Visualization over Urban Silhouette
Financial Data Analysis with Graphs and Charts on Dark Background
Premium
Man typing on laptop with digital receiving invoice and document management icons. Business accounting, data processing, and automation technology for financial operations productivity
Financial Data Visualization in Modern Digital Display Office
Digital Data Analytics with Financial Graphs and Indigo Background
Financial Data Charts with Network Connections Digital Interface
Analyzing Growing Graph Line on Purple Gradient Background
Premium
Individuals filing tax returns online using a computer for federal or state tax payments, emphasizing digital compliance and data processing
Financial Graph and Cityscape Analysis with Technological Overlay
Dynamic Forex Market Chart with Multiple Currencies and Growth Trends
Digital Financial Data Analysis on Dark Background
Digital Stock Market Chart and Networking Interface
Premium
Future financial network where digital currencies intersect with light-speed communication
Red Trend Line Tracking Social Engagement and Performance Metrics on Digital Dashboard
Candlestick Chart with Financial Data on Grid Background
Graph Showing Stock Market Activity and Financial Data Analysis
Rising Green Line Chart Overlays Concept of Financial Growth
Digital Financial Data Processing and Analysis Graphics
Financial Data Analysis with Digital Graph Overlay
3D Holographic Chart on Futuristic Virtual Display
Financial Data Chart Over City Silhouette
Abstract Graph with Social Media Notification Icons and Data Points
Digital Interface with Overlapping Code and Graph
Financial Chart with Dynamic Data on Black Grid
Financial Data Analysis with Trend Line and Statistics
Premium
Modern abstract digital illustration depicting a complex network of interconnected glowing cubes, symbolizing data flow, secure transactions, and advanced technological infrastructure
Dynamic Financial Data on Dark Background With Colorful Graphs
Futuristic 3D Bar Chart with Neon Effects in Grid Environment
Cityscape Enhances Financial Data Visualization Digital Concept
Dynamic Financial Data Analysis in Digital Interface
Futuristic Data Processing Interface with Dynamic Graphs
Premium
Businessman signing digital contract, business innovation concept. Technology connection, verification, compliance, finance, network, futuristic strategy, secure data processing.
Premium
Modern office scene with digital document processing and team collaboration
Dynamic Financial Stock Market Analysis Display
Holographic Financial Data Visualization with Stock Trends
Sharp Decline in Stock Market Graph Against Red Financial Data Background
Financial Graph Over Cityscape Depicting Data Trends and Analytics
Premium
A person's hand interacts with a digital interface for tax refund processing
Dynamic Digital Display of Financial Data
Digital Currency Trading Interface with Data Visualization
Futuristic Data Trend Graphs on Digital Interface
Futuristic Financial Data Analysis with Graphs and Charts
Premium
Professional businessman interacts with digital interface for claims processing and financial protection
Declining Stock Market Graph with Red Trend Line
Pink Graph and Data Analysis on 3D Grid for Financial Trends
Explore More Free Stock Images