- Home >
- Stock Photos >
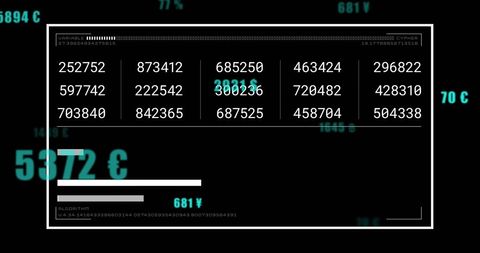
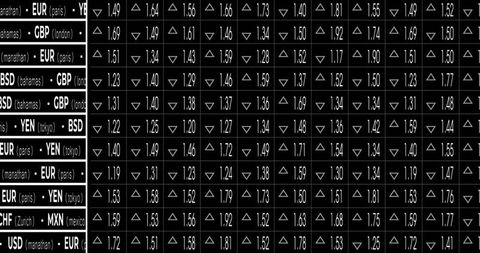
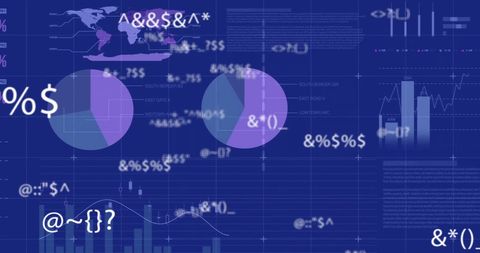
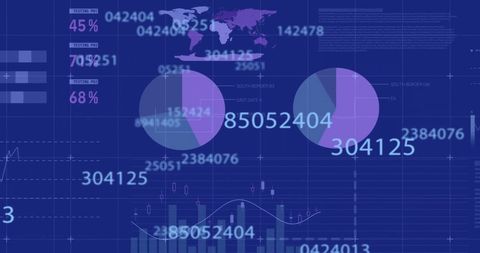
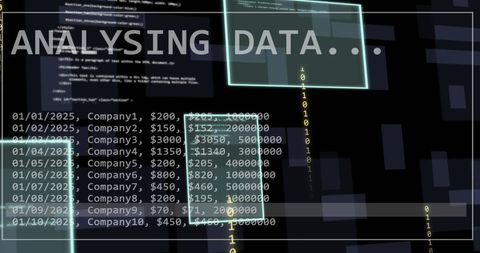
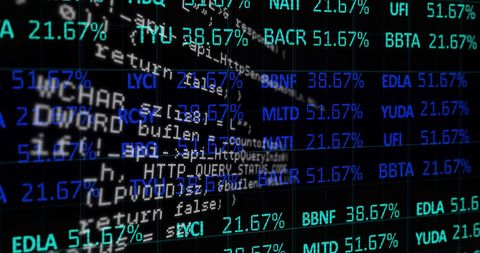
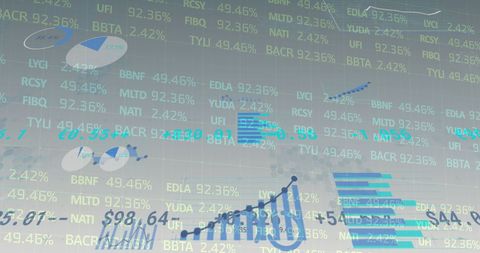
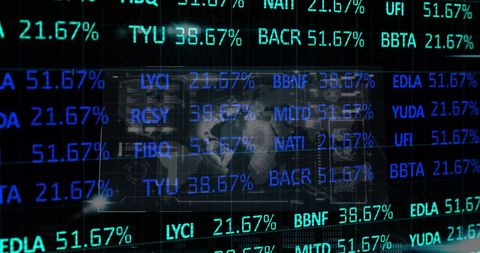
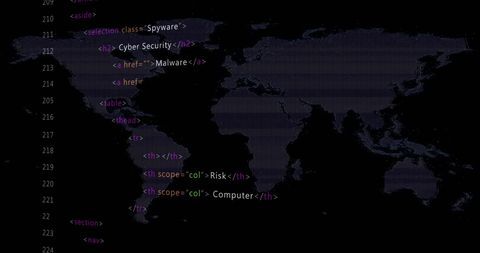
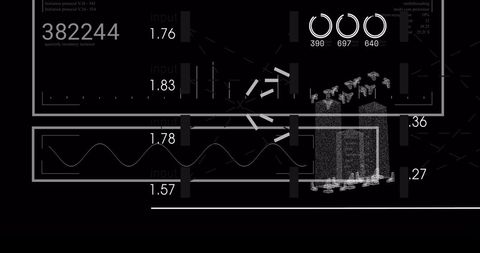
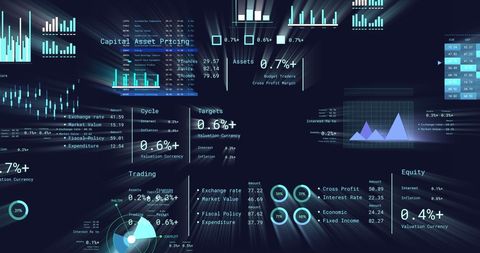
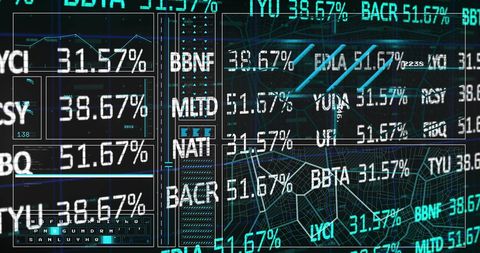
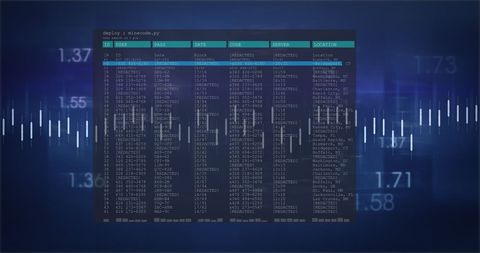
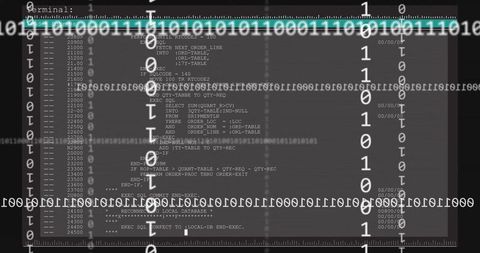
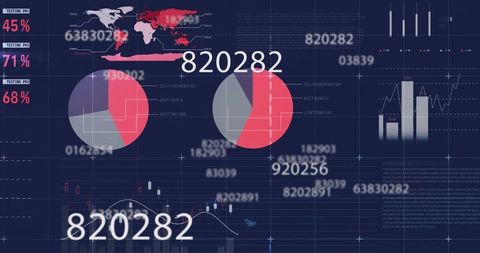
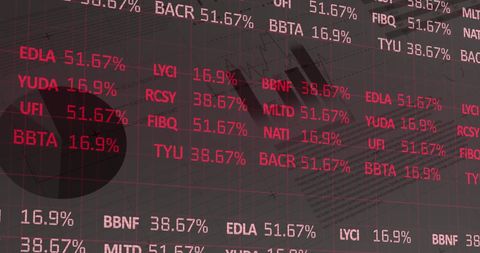
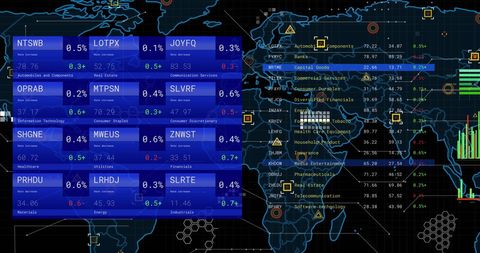
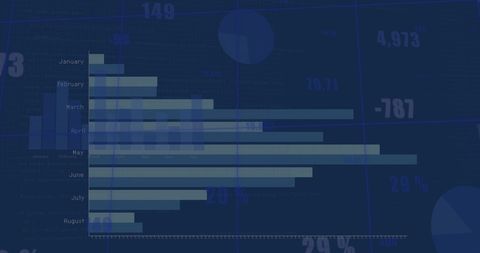
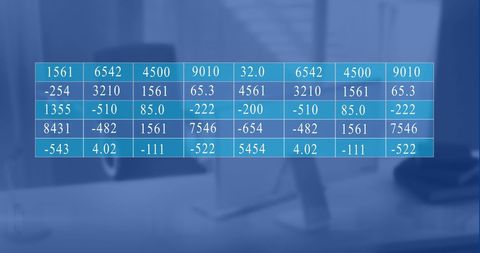
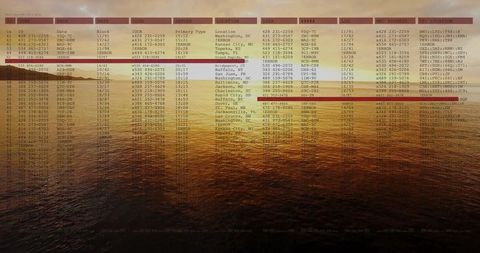
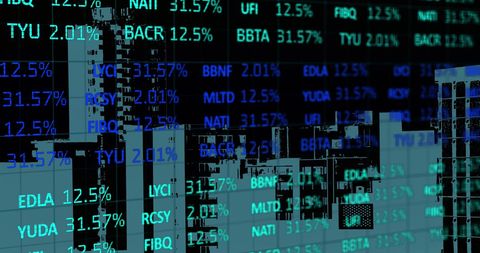
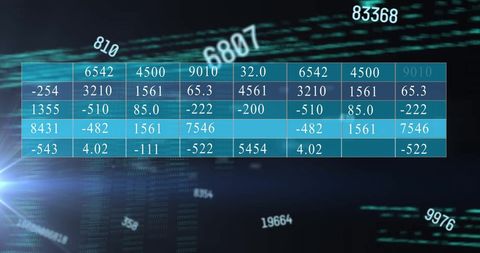
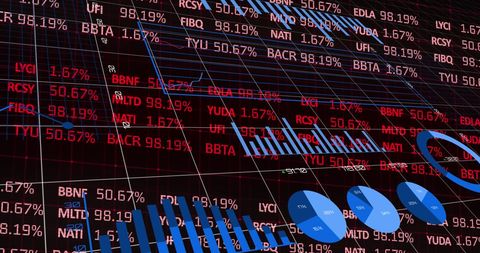
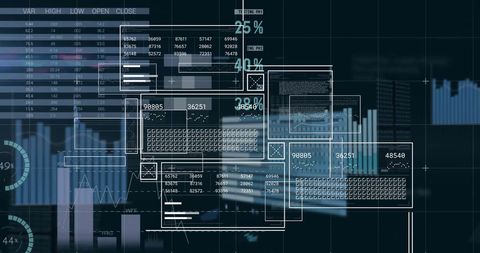
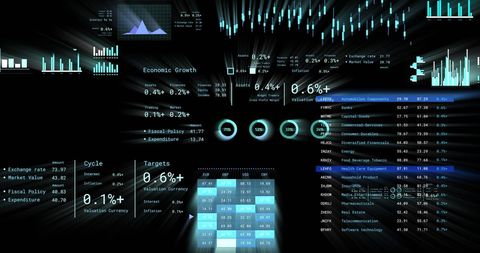
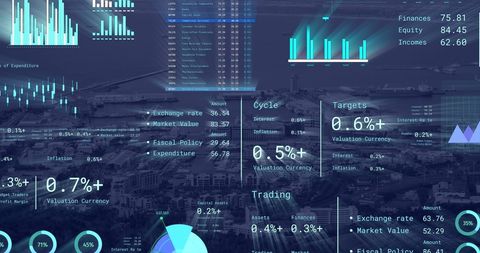
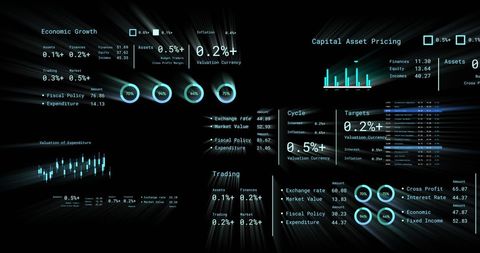
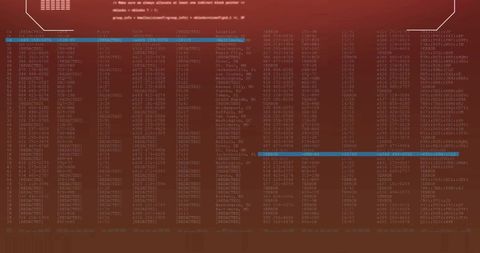
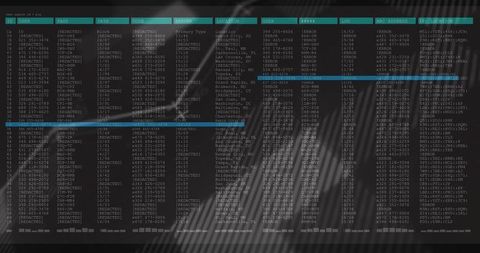
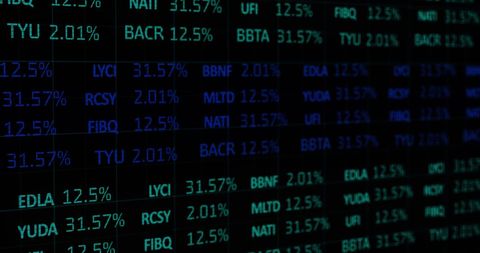
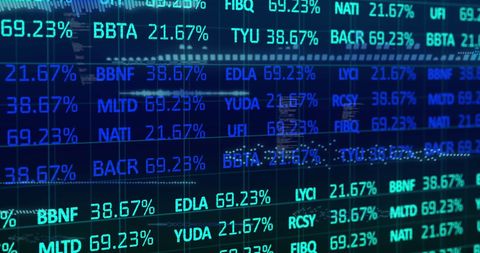
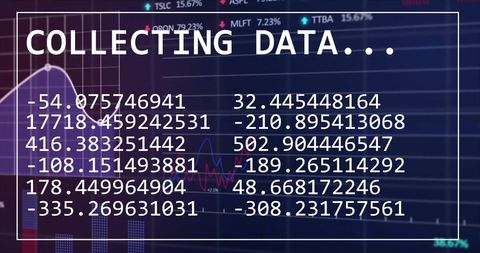
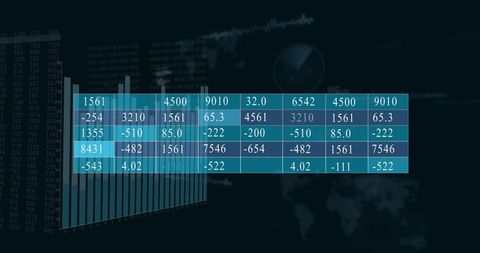
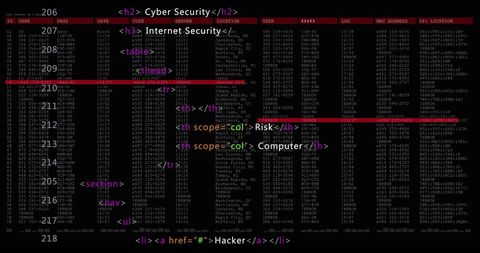
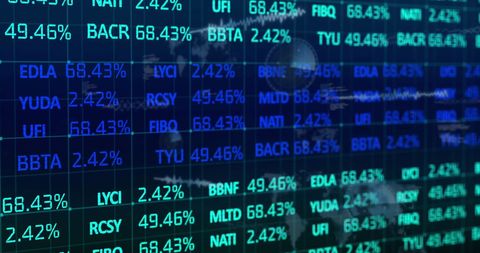
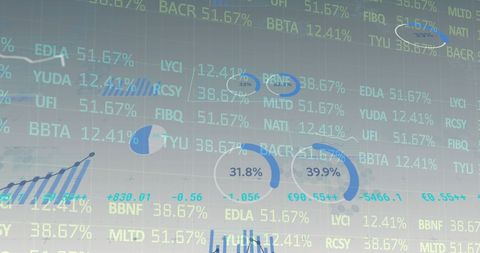
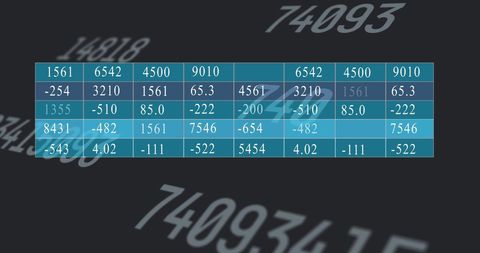
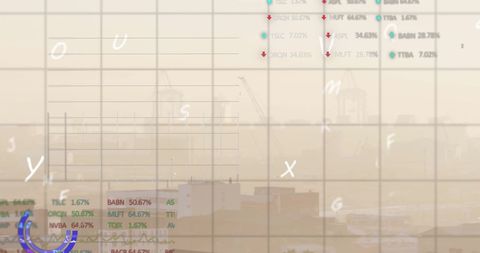
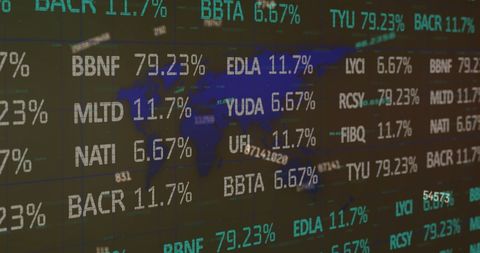
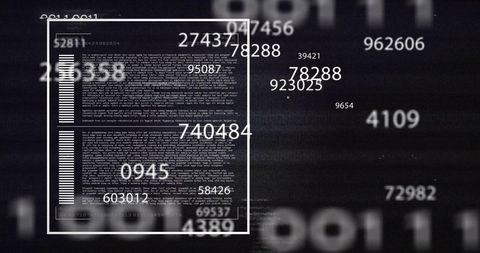
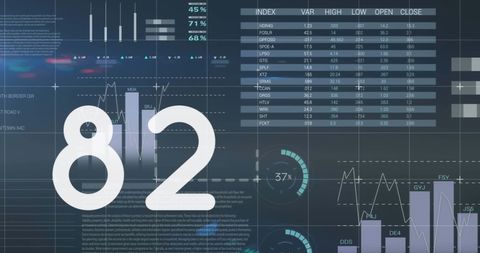
- Visualized Financial and Data Analysis with Coding Elements
Visualized Financial and Data Analysis with Coding Elements Image
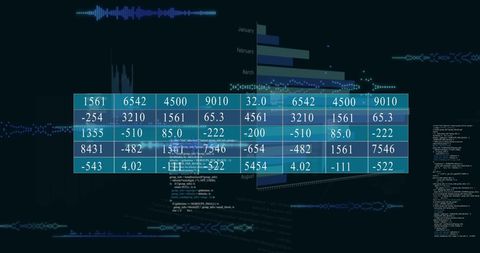
Graphic displays interconnectedness of various technologies used in finance and data analytics. Shows coding script backdrop alongside numeric data and charts suggestive of computer interface. Ideal for illustrating advanced technology applications, presentations on digital finance solutions, or educational content on programming and data science.

downloads
Tags:
More
Credit Photo
If you would like to credit the Photo, here are some ways you can do so
Text Link
photo Link
<span class="text-link">
<span>
<a target="_blank" href=https://pikwizard.com/photo/visualized-financial-and-data-analysis-with-coding-elements/eb0a46bcc84c1f0f3b12c89a61644686/>PikWizard</a>
</span>
</span>
<span class="image-link">
<span
style="margin: 0 0 20px 0; display: inline-block; vertical-align: middle; width: 100%;"
>
<a
target="_blank"
href="https://pikwizard.com/photo/visualized-financial-and-data-analysis-with-coding-elements/eb0a46bcc84c1f0f3b12c89a61644686/"
style="text-decoration: none; font-size: 10px; margin: 0;"
>
<img src="https://pikwizard.com/pw/medium/eb0a46bcc84c1f0f3b12c89a61644686.jpg" style="margin: 0; width: 100%;" alt="" />
<p style="font-size: 12px; margin: 0;">PikWizard</p>
</a>
</span>
</span>
Free (free of charge)
Free for personal and commercial use.
Author: Awesome Content