- Home >
- Stock Photos >
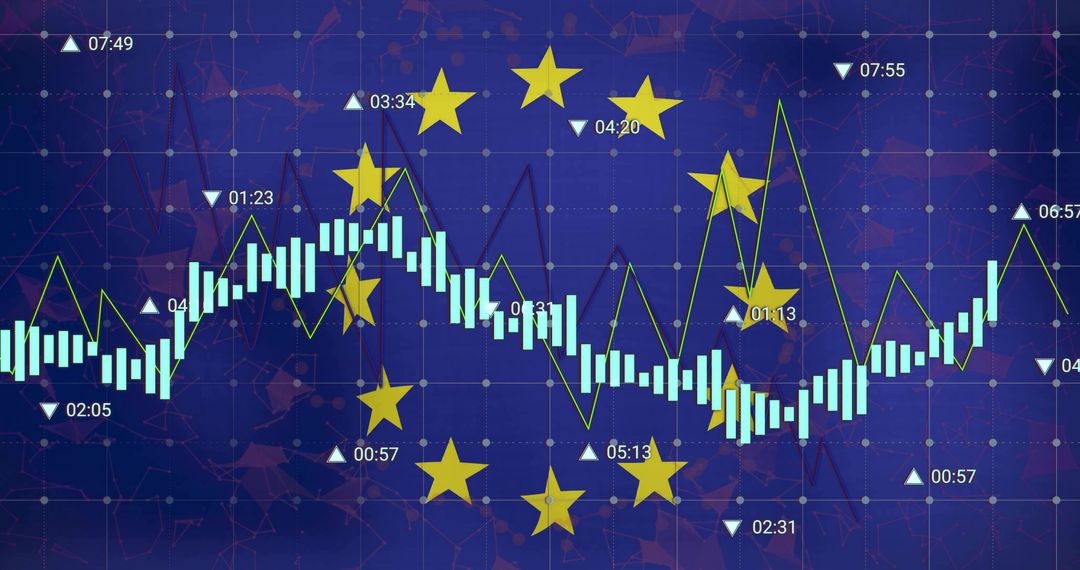
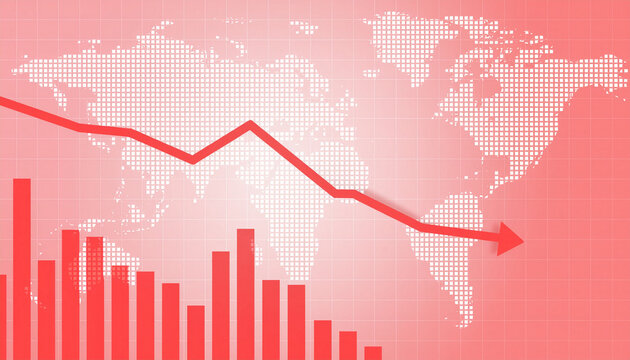
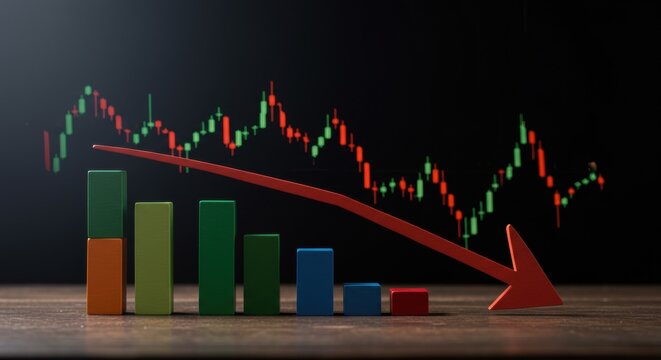
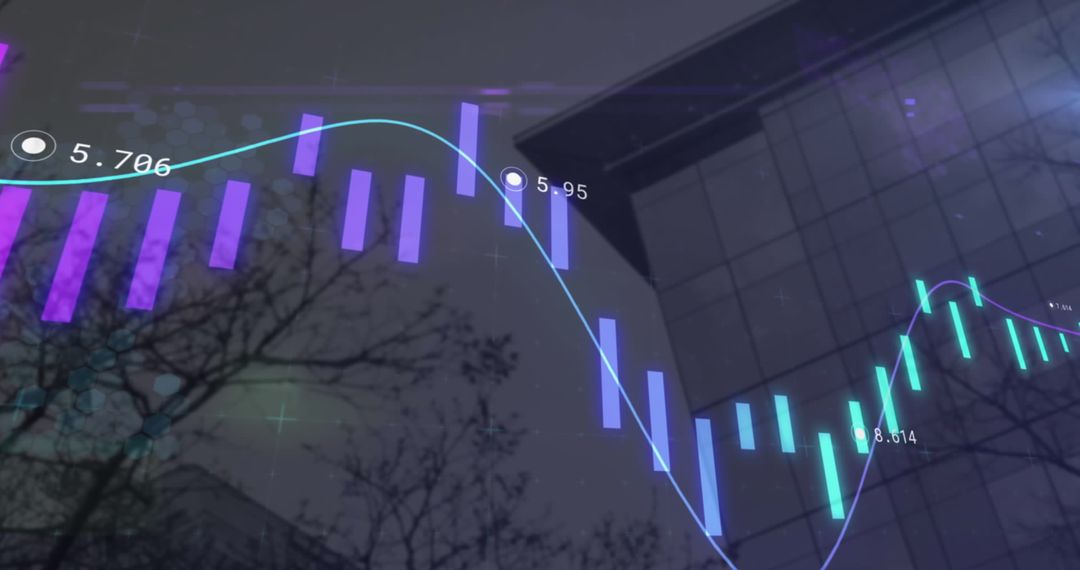
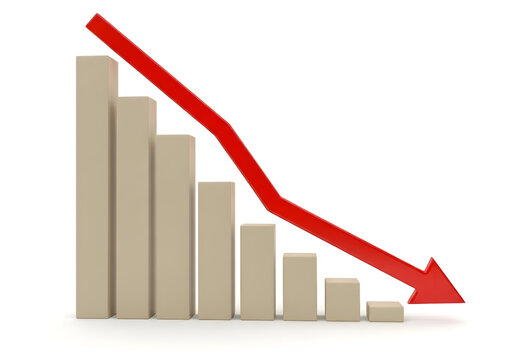
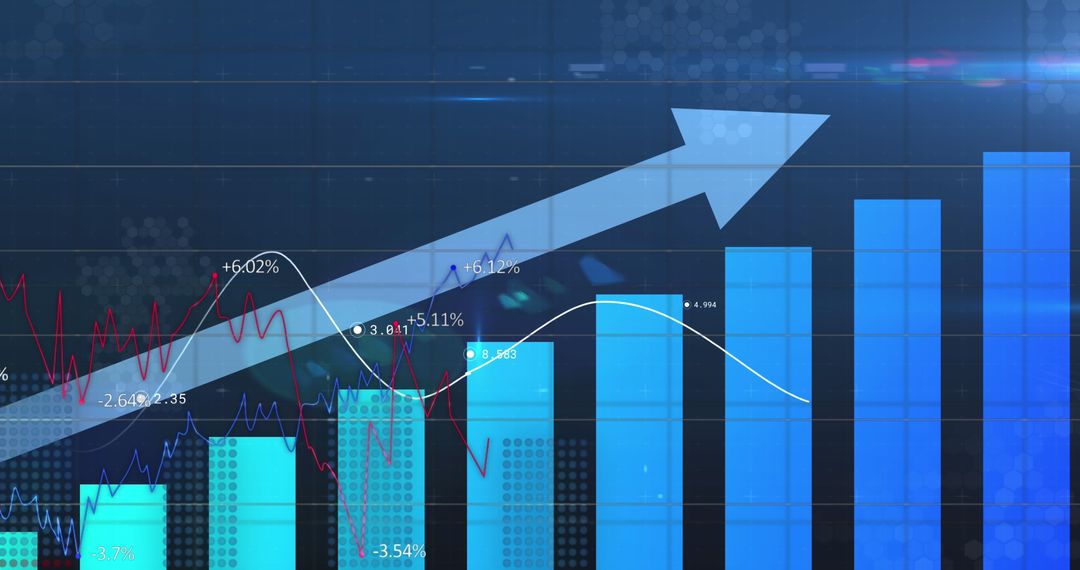
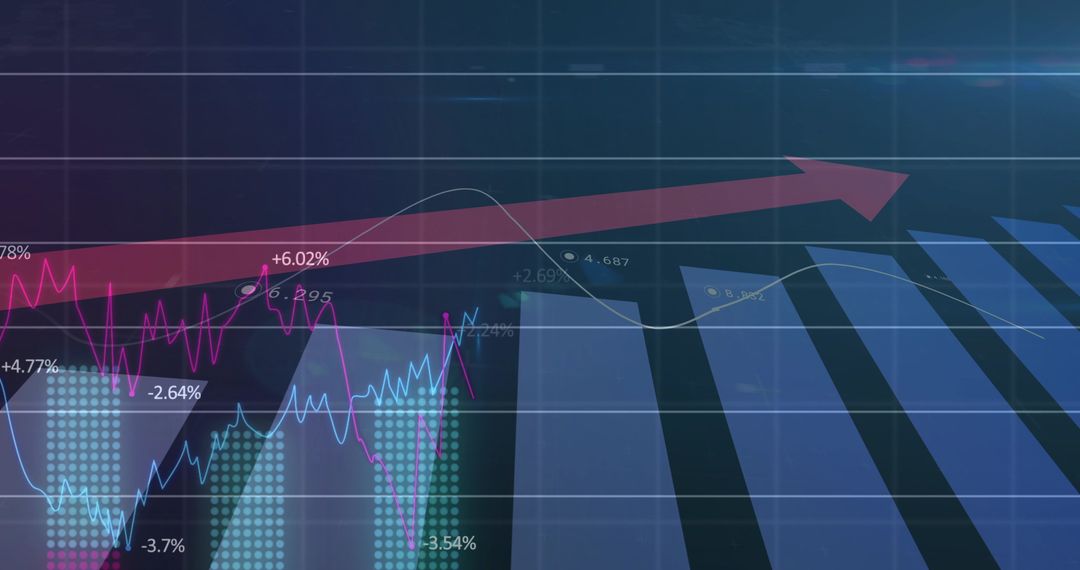
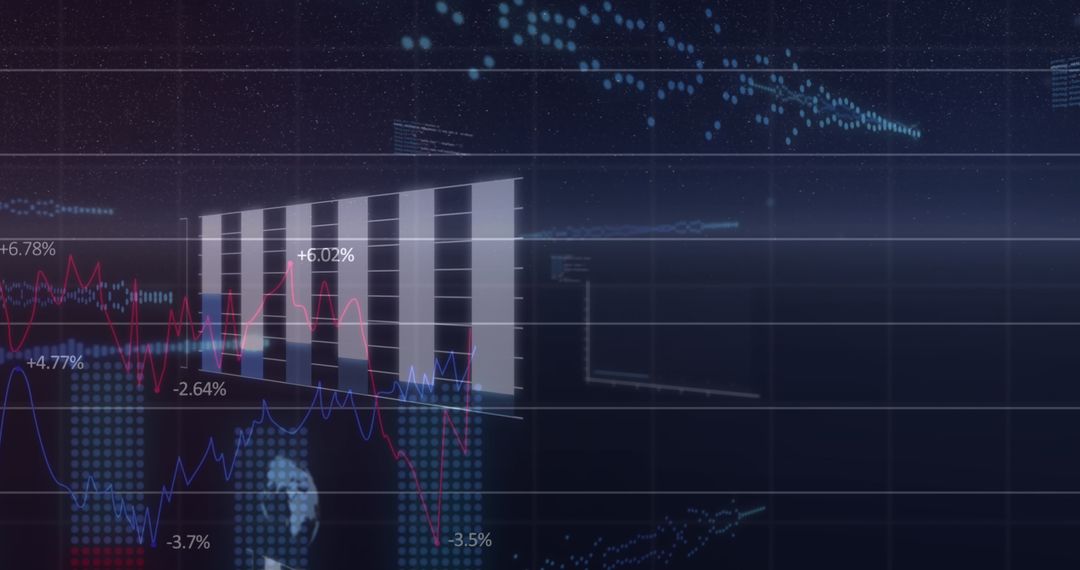
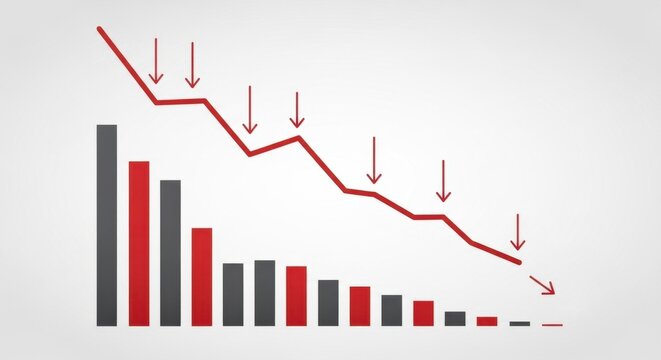
- Visualizing Economic Decline and Financial Trends with Data Charts
Visualizing Economic Decline and Financial Trends with Data Charts Image

Illustrating an economic decline using vibrant graphs and arrows. Attractive for presentations on financial trends and market analysis. Ideal for digital data-related topics in economics, business, and financial analysis fields.
Powered by 


2
downloads
downloads
Tags:
More
Credit Photo
If you would like to credit the Photo, here are some ways you can do so
Text Link
photo Link
<span class="text-link">
<span>
<a target="_blank" href=https://pikwizard.com/photo/visualizing-economic-decline-and-financial-trends-with-data-charts/fb49408ead39f6bedeeb64a44bf28960/>PikWizard</a>
</span>
</span>
<span class="image-link">
<span
style="margin: 0 0 20px 0; display: inline-block; vertical-align: middle; width: 100%;"
>
<a
target="_blank"
href="https://pikwizard.com/photo/visualizing-economic-decline-and-financial-trends-with-data-charts/fb49408ead39f6bedeeb64a44bf28960/"
style="text-decoration: none; font-size: 10px; margin: 0;"
>
<img src="https://pikwizard.com/pw/medium/fb49408ead39f6bedeeb64a44bf28960.jpg" style="margin: 0; width: 100%;" alt="" />
<p style="font-size: 12px; margin: 0;">PikWizard</p>
</a>
</span>
</span>
Free (free of charge)
Free for personal and commercial use.
Author: Authentic Images
Similar Free Stock Images

Premium


Premium


Premium


Premium


Premium


Premium


Premium


Premium


Premium


Premium


Premium


Premium


Premium


Premium


Premium


Premium


Premium


Premium


Premium


Premium


Premium


Premium


Premium


Premium