- Home >
- Stock Photos >
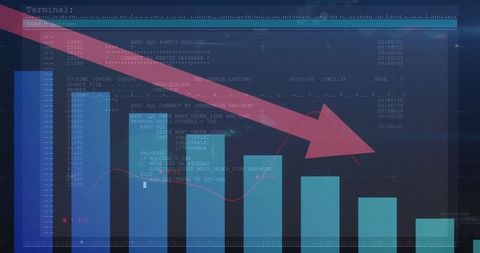
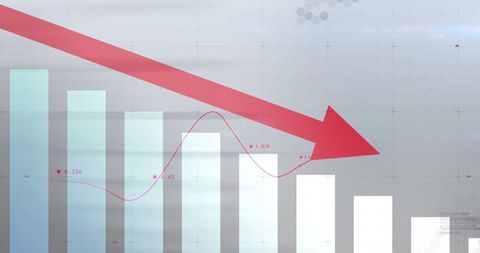
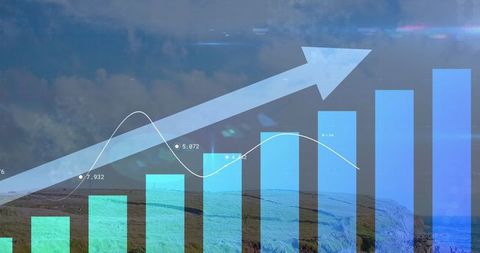
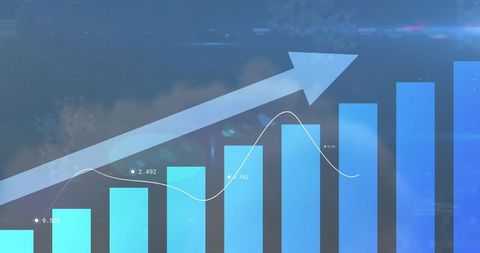
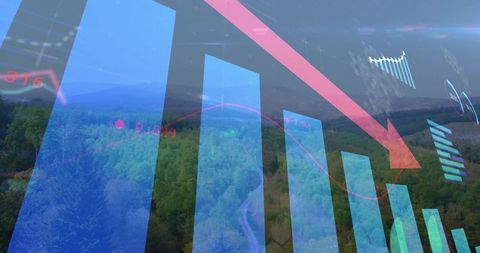
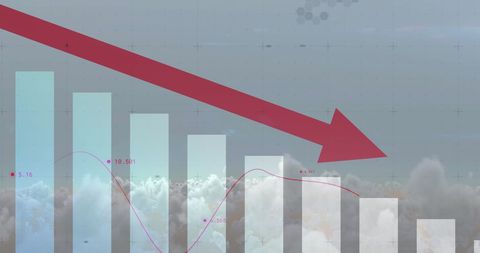
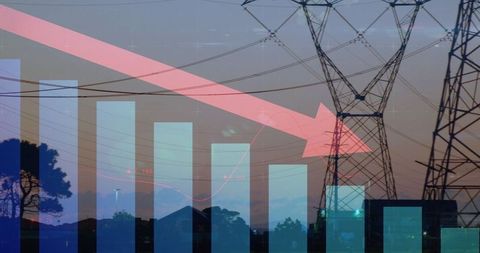
- Visualizing Environmental Analytics with Declining Trend and Scenic Landscape
Visualizing Environmental Analytics with Declining Trend and Scenic Landscape Image
This composite shows a bar chart with a downward trend overlaying a serene dusk landscape, possibly indicating economic or environmental data insights. The setting evokes clarity juxtaposed with the concept of decline, useful for presentations related to ecological concerns, financial downturns, or statistical analyses in a visually engaging manner.

downloads
Tags:
More
Credit Photo
If you would like to credit the Photo, here are some ways you can do so
Text Link
photo Link
<span class="text-link">
<span>
<a target="_blank" href=https://pikwizard.com/photo/visualizing-environmental-analytics-with-declining-trend-and-scenic-landscape/c8a24c01ace680a8ac011ce403d26c76/>PikWizard</a>
</span>
</span>
<span class="image-link">
<span
style="margin: 0 0 20px 0; display: inline-block; vertical-align: middle; width: 100%;"
>
<a
target="_blank"
href="https://pikwizard.com/photo/visualizing-environmental-analytics-with-declining-trend-and-scenic-landscape/c8a24c01ace680a8ac011ce403d26c76/"
style="text-decoration: none; font-size: 10px; margin: 0;"
>
<img src="https://pikwizard.com/pw/medium/c8a24c01ace680a8ac011ce403d26c76.jpg" style="margin: 0; width: 100%;" alt="" />
<p style="font-size: 12px; margin: 0;">PikWizard</p>
</a>
</span>
</span>
Free (free of charge)
Free for personal and commercial use.
Author: People Creations