
- Home >
- Stock Photos >
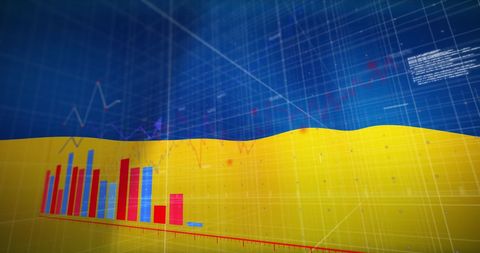
- Visualizing Financial Data with Abstract Blue Bar Graph
Visualizing Financial Data with Abstract Blue Bar Graph Image

Abstract representation of financial data presented as a bar graph against a blue background, illustrating concepts of business analysis and digital data processing. Suitable for use in presentations on finance, technology, and global business advancements, highlighting themes of statistical analysis and technological data visualization efficacy.
Powered by 


downloads
Tags:
More
Credit Photo
If you would like to credit the Photo, here are some ways you can do so
Text Link
photo Link
<span class="text-link">
<span>
<a target="_blank" href=https://pikwizard.com/photo/visualizing-financial-data-with-abstract-blue-bar-graph/7568cf2e817577f3051b86c121b7a31e/>PikWizard</a>
</span>
</span>
<span class="image-link">
<span
style="margin: 0 0 20px 0; display: inline-block; vertical-align: middle; width: 100%;"
>
<a
target="_blank"
href="https://pikwizard.com/photo/visualizing-financial-data-with-abstract-blue-bar-graph/7568cf2e817577f3051b86c121b7a31e/"
style="text-decoration: none; font-size: 10px; margin: 0;"
>
<img src="https://pikwizard.com/pw/medium/7568cf2e817577f3051b86c121b7a31e.jpg" style="margin: 0; width: 100%;" alt="" />
<p style="font-size: 12px; margin: 0;">PikWizard</p>
</a>
</span>
</span>
Free (free of charge)
Free for personal and commercial use.
Author: Awesome Content
Similar Free Stock Images

Premium

Premium

Premium


Premium


Premium


Premium


Premium


Premium


Premium


Premium


Premium


Premium


Premium


Premium


Premium


Premium


Premium


Premium


Premium

Premium

Premium


Premium


Premium


Premium


Premium


Explore More Free Stock Images