- Home >
- Stock Photos >
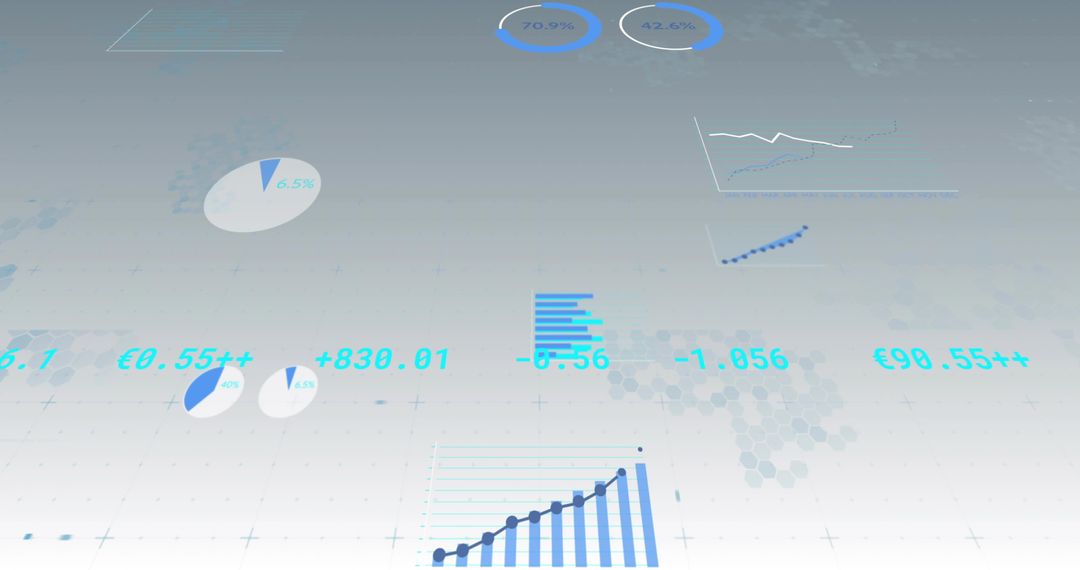
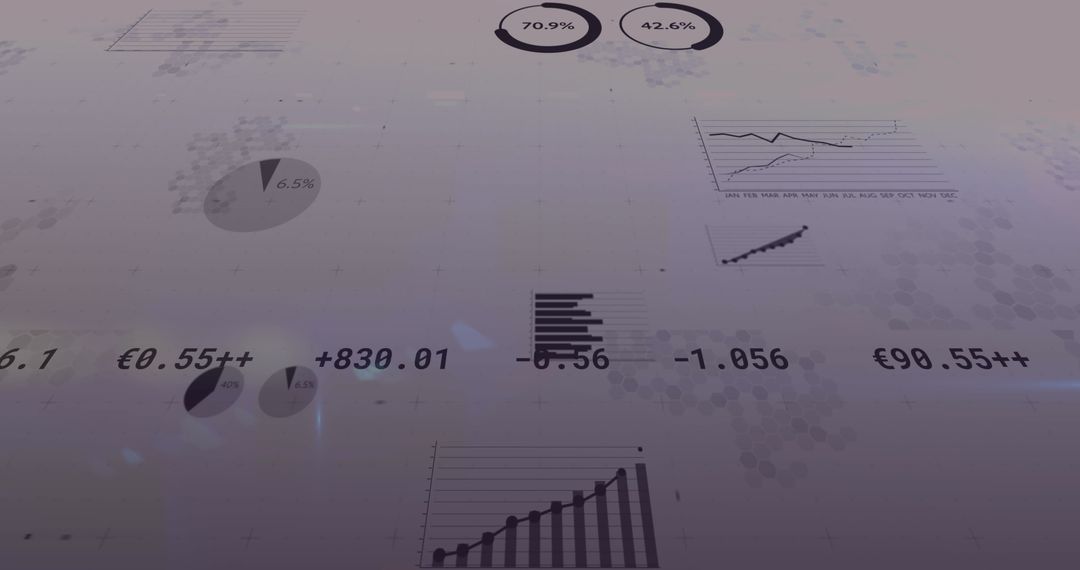
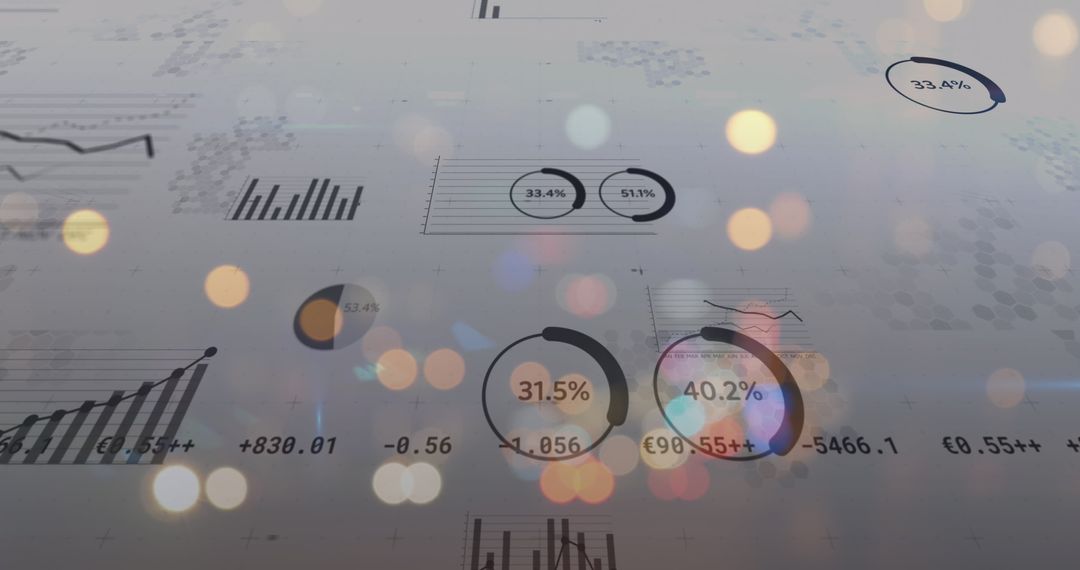
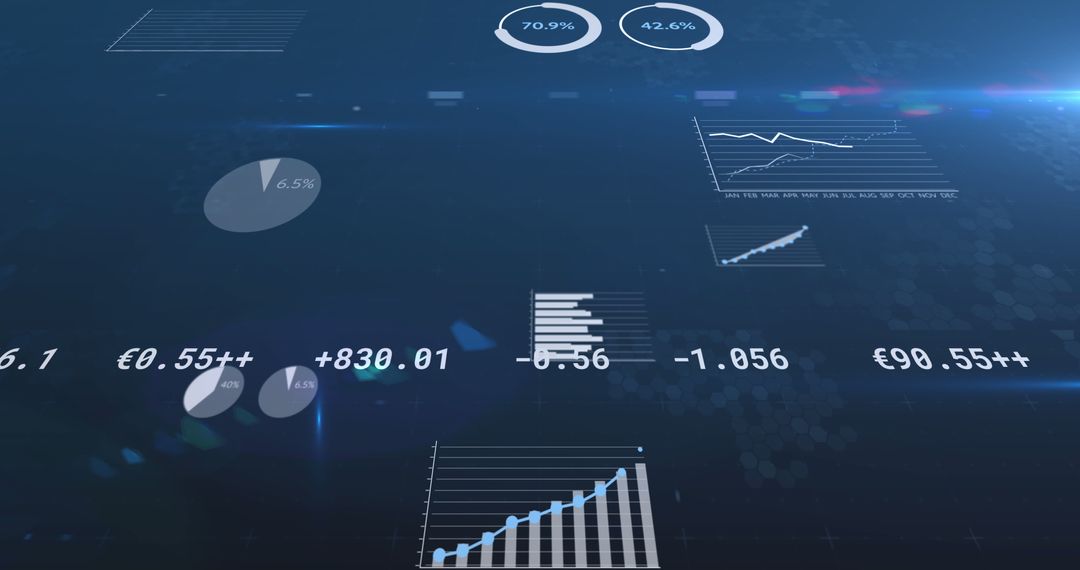
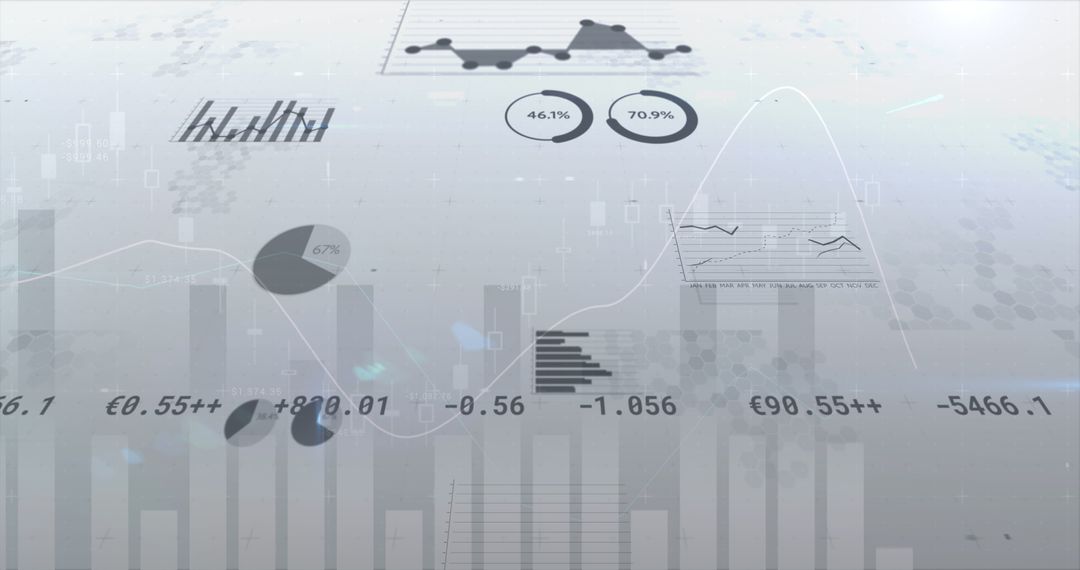
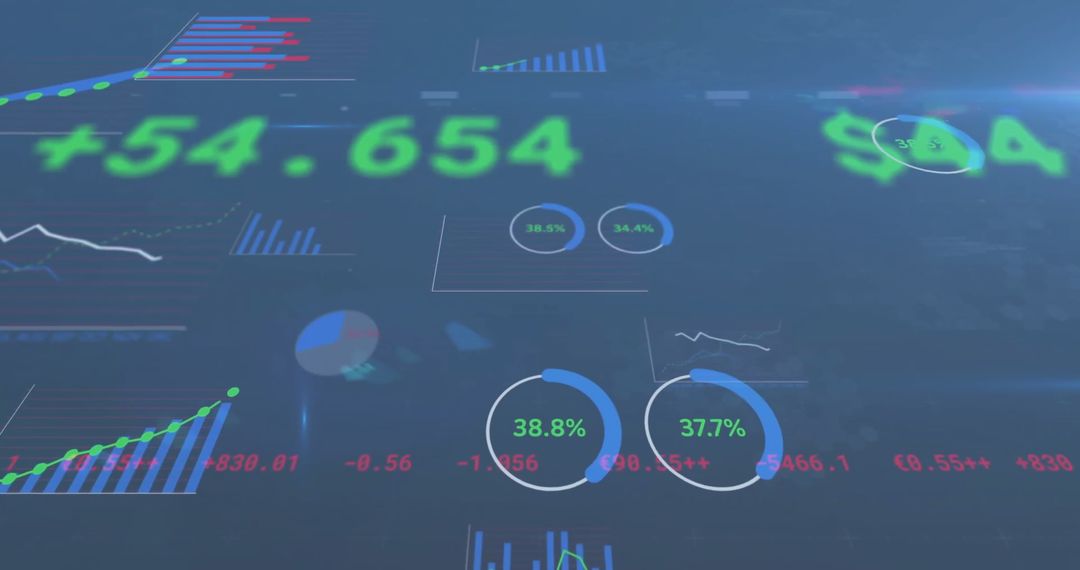
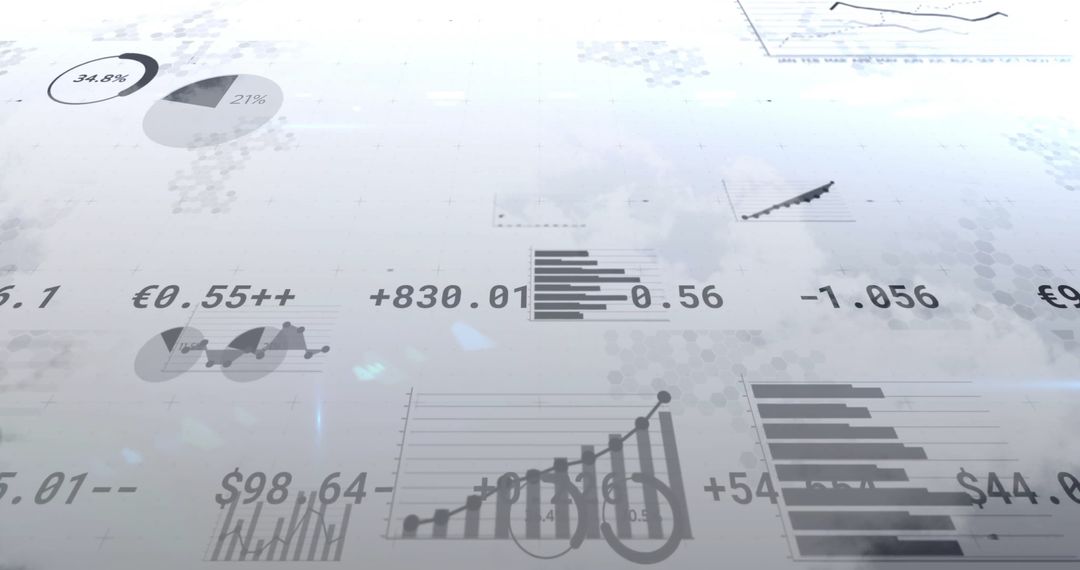
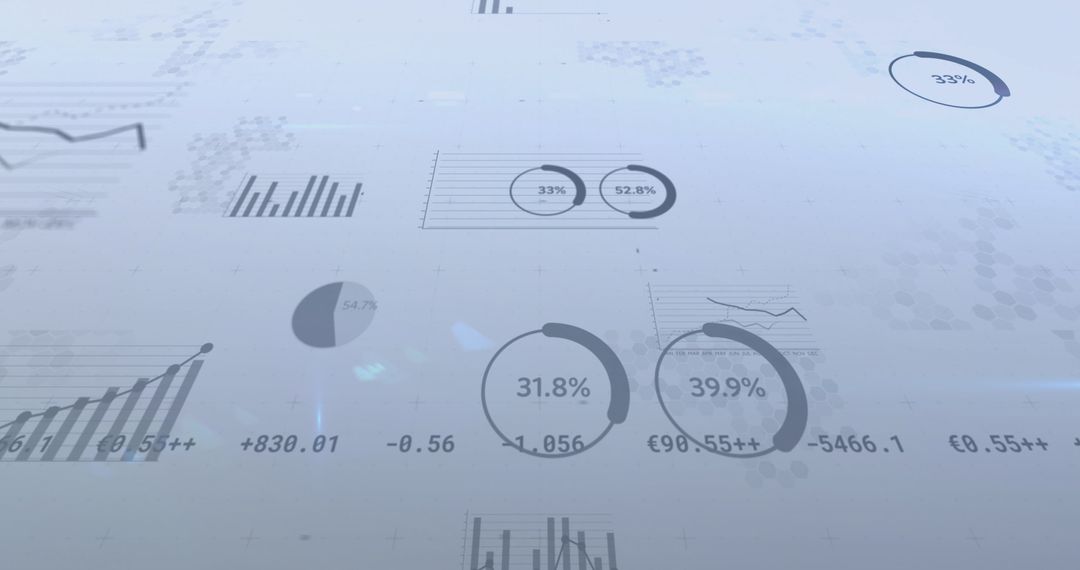
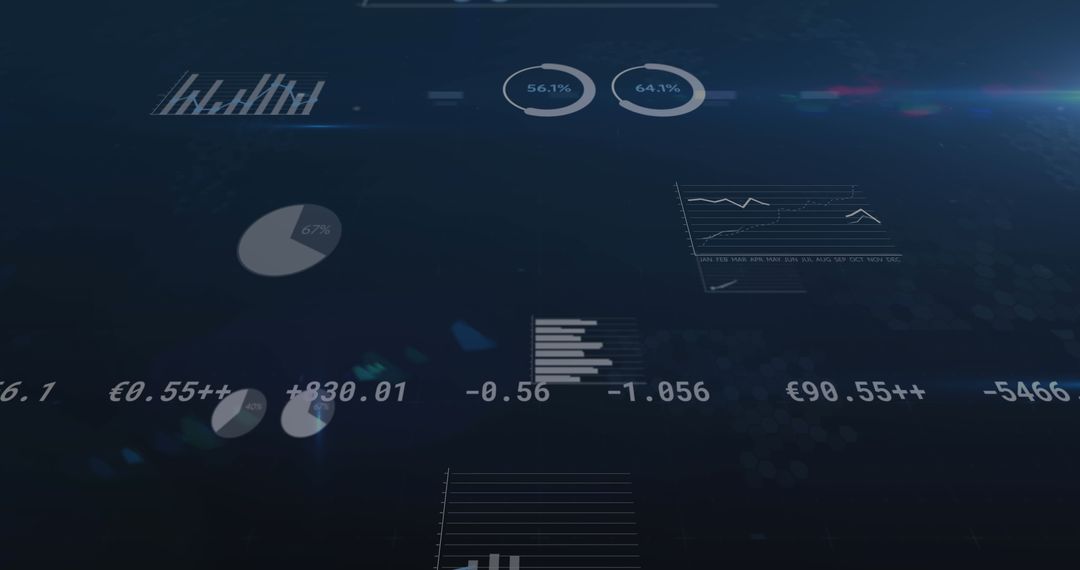
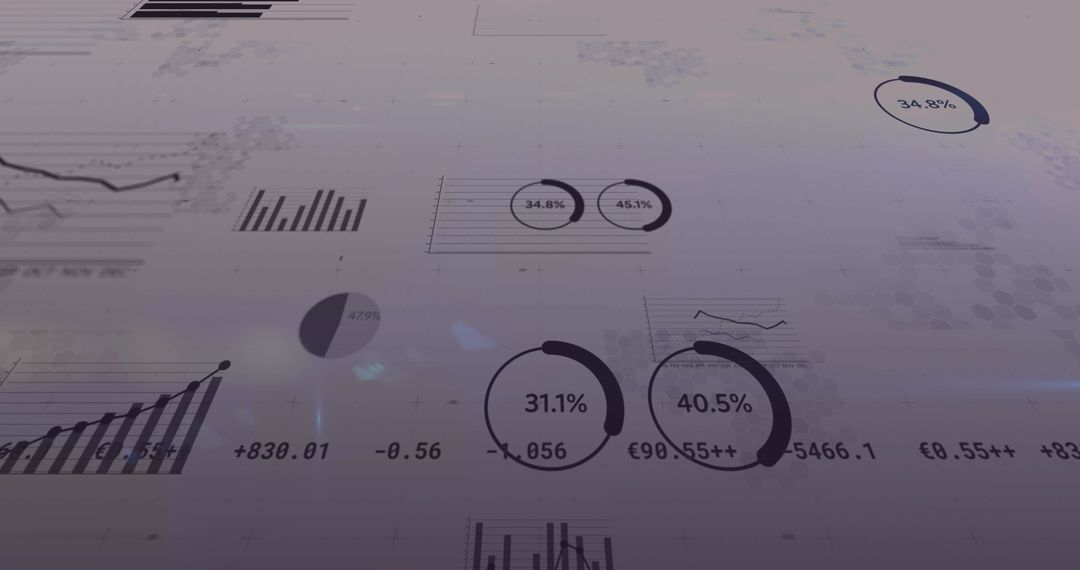
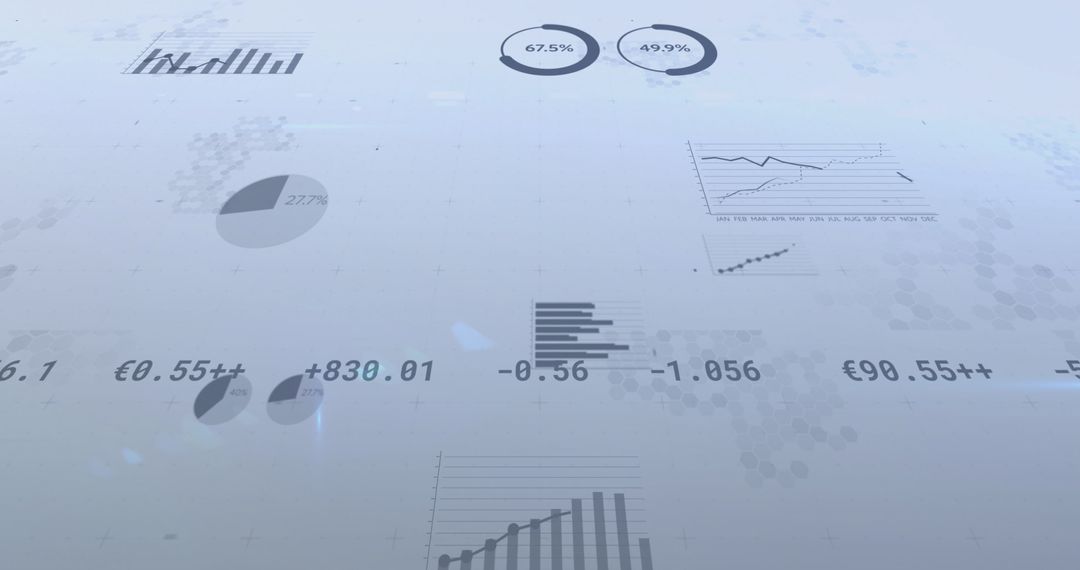
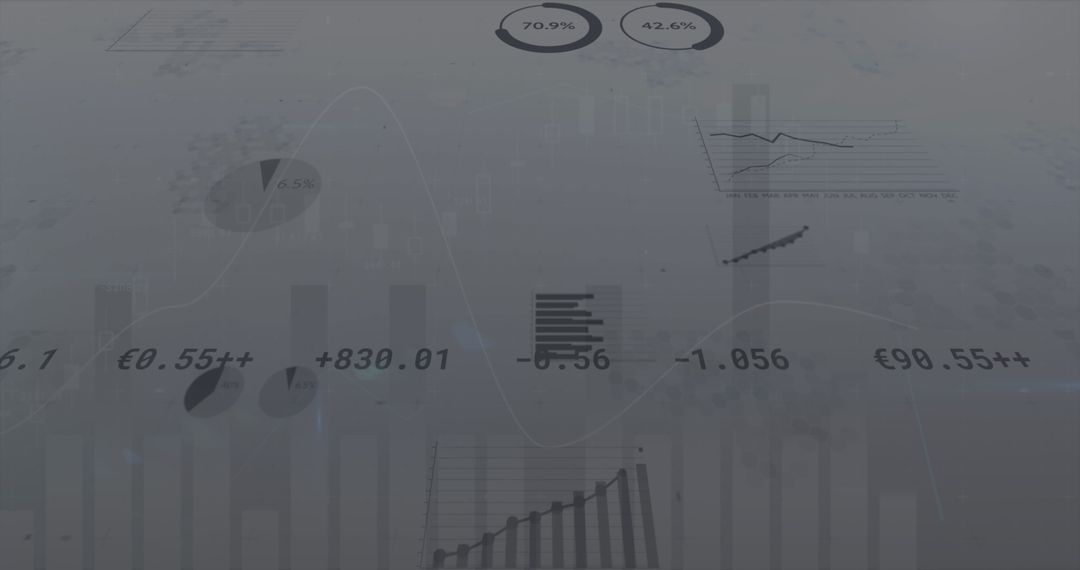
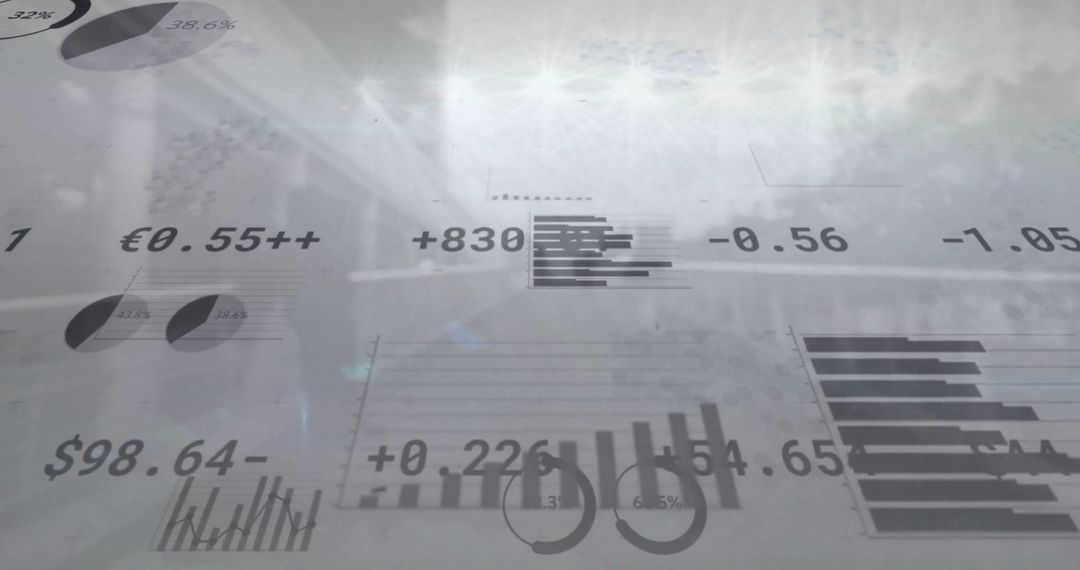
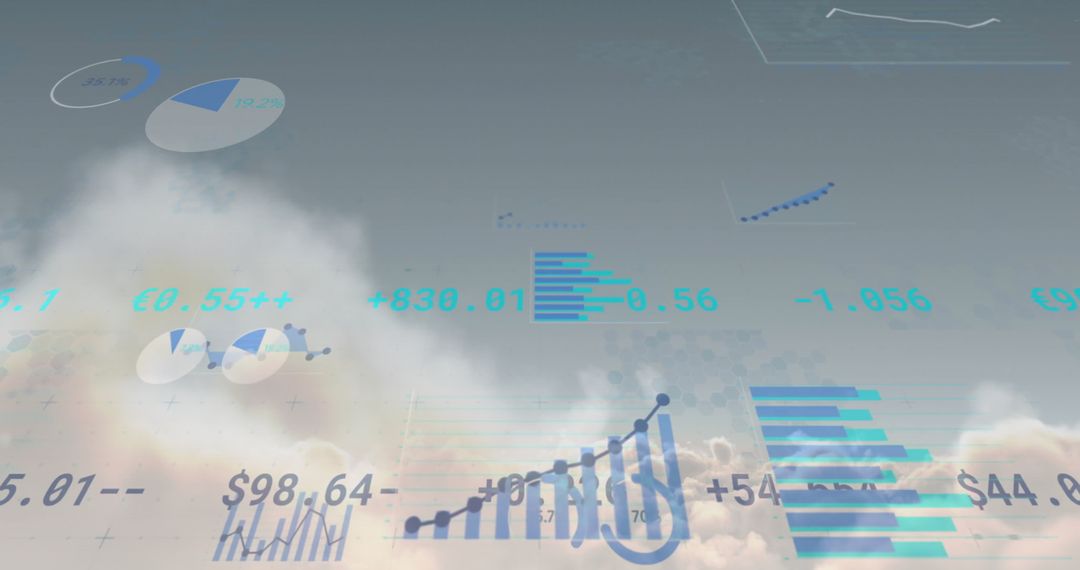
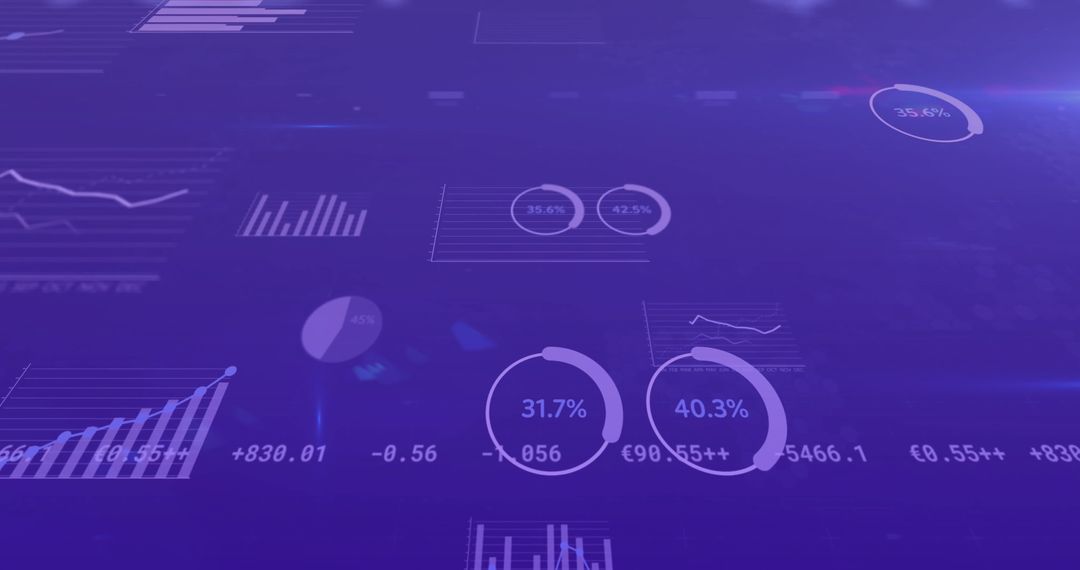
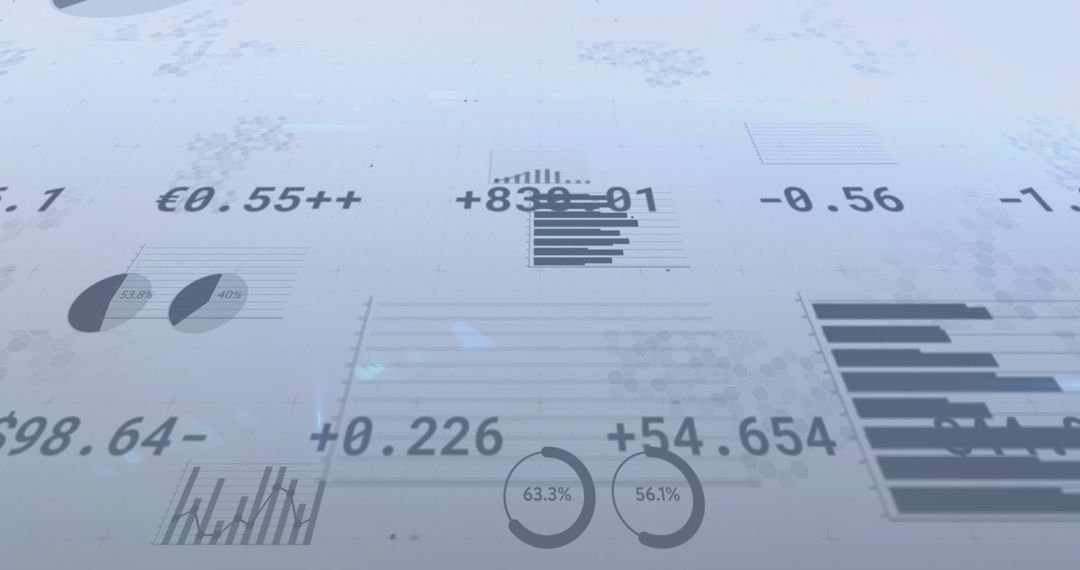
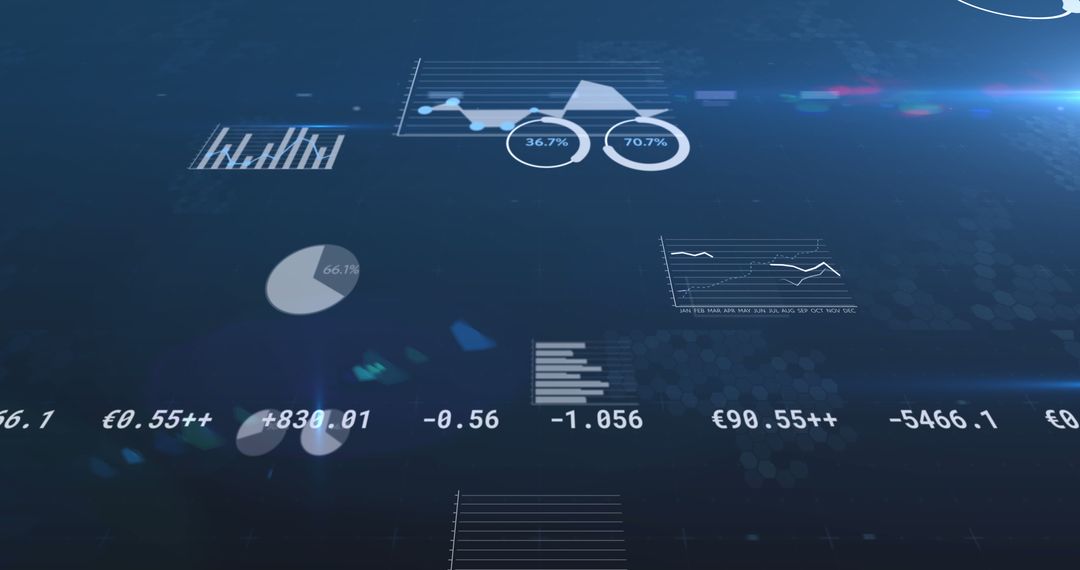
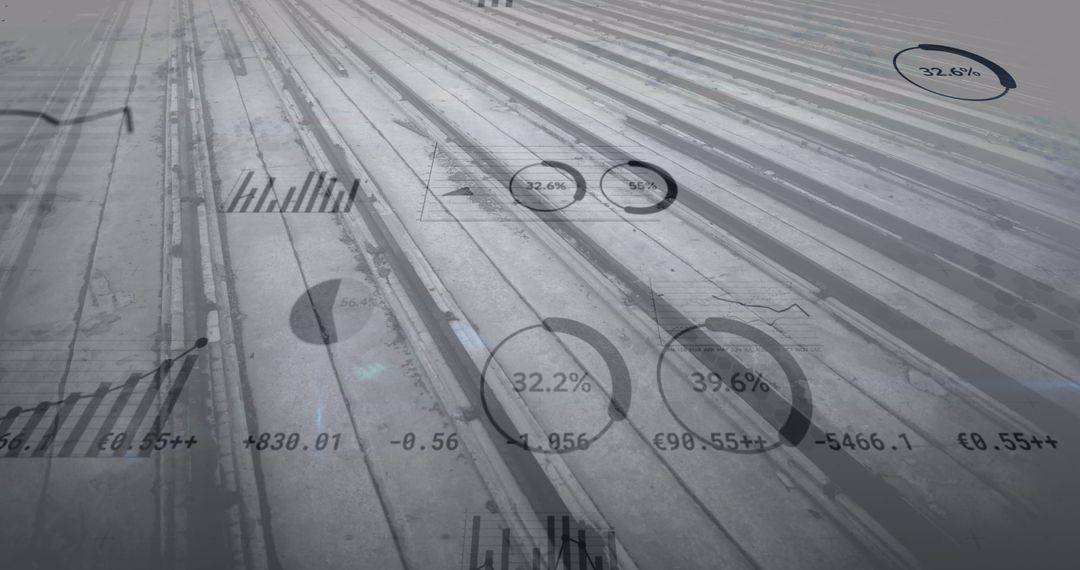
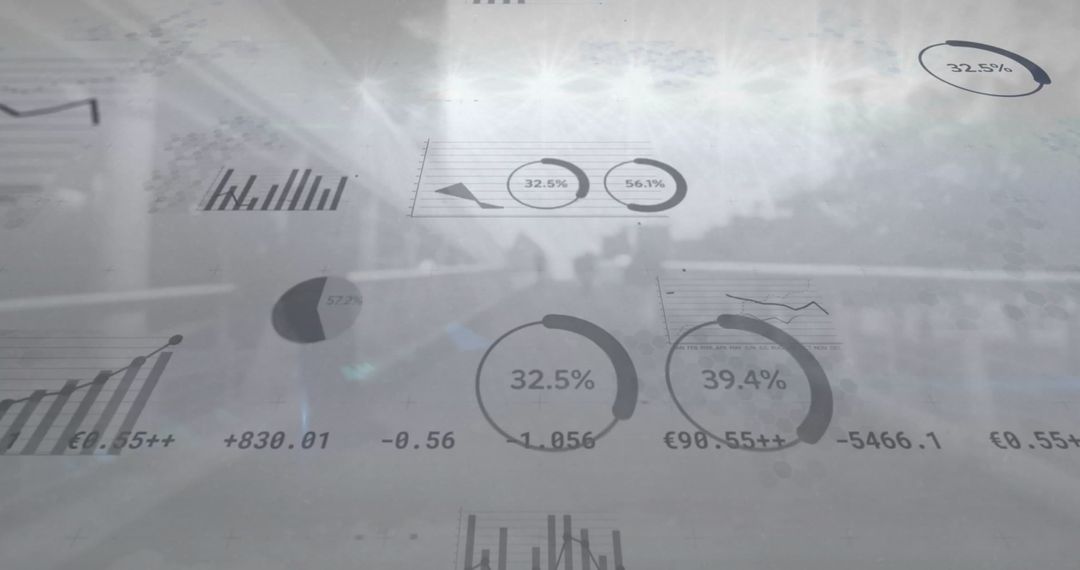
- Visualizing Financial Data with Infographics and Charts
Visualizing Financial Data with Infographics and Charts Image
Creative illustration showing various financial graphs and statistical data, giving insight into business trends and economic forecasts. Ideal for use in corporate presentations, financial reports, economic articles, or any context where visualization of quantitative information enhances understanding.
Powered by 


0
downloads
downloads
Tags:
More
Credit Photo
If you would like to credit the Photo, here are some ways you can do so
Text Link
photo Link
<span class="text-link">
<span>
<a target="_blank" href=https://pikwizard.com/photo/visualizing-financial-data-with-infographics-and-charts/0591145255bdb0437ba265c63be189a3/>PikWizard</a>
</span>
</span>
<span class="image-link">
<span
style="margin: 0 0 20px 0; display: inline-block; vertical-align: middle; width: 100%;"
>
<a
target="_blank"
href="https://pikwizard.com/photo/visualizing-financial-data-with-infographics-and-charts/0591145255bdb0437ba265c63be189a3/"
style="text-decoration: none; font-size: 10px; margin: 0;"
>
<img src="https://pikwizard.com/pw/medium/0591145255bdb0437ba265c63be189a3.jpg" style="margin: 0; width: 100%;" alt="" />
<p style="font-size: 12px; margin: 0;">PikWizard</p>
</a>
</span>
</span>
Free (free of charge)
Free for personal and commercial use.
Author: Authentic Images
Similar Free Stock Images
Premium


Premium


Premium


Premium


Premium


Premium


Premium


Premium


Premium


Premium


Premium


Premium


Premium


Premium


Premium


Premium


Premium


Premium


Premium


Premium


Premium


Premium


Premium


Premium