- Home >
- Stock Photos >
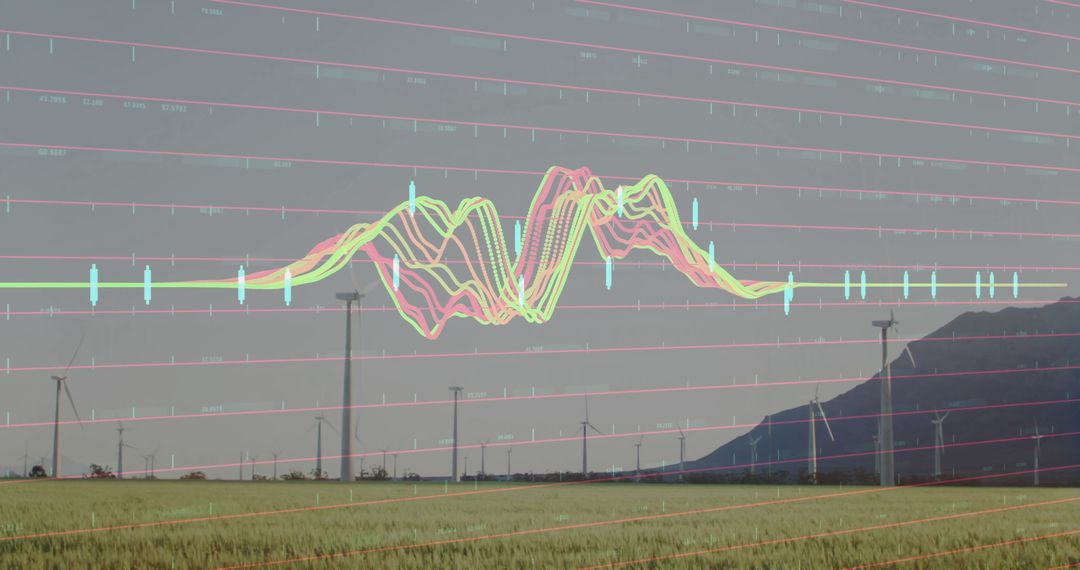
- Visualizing financial data with multicolored candlestick bars, trend lines and watercolor grid
Visualizing financial data with multicolored candlestick bars, trend lines and watercolor grid Image
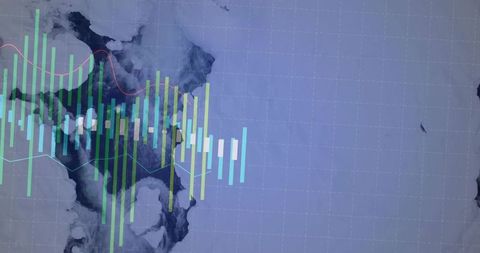
Visualization showing multicolored candlestick bars and vertical histogram columns over pale grid and watercolor map texture, with red and teal trend lines adding directional emphasis. Working well for financial reports, trading platform banners, fintech websites, investor presentations, market analysis blogs, social media ads, and educational slides. Offering right-side negative space for headline, logo, data overlay, or call-to-action. Supporting modern fintech and data-driven branding through teal, green, blue palette and subtle watercolor textures. Enabling easy cropping for wide banners, widescreen presentations, and dashboard headers. Suggesting use in marketing campaigns, investor decks, editorial features, UI mockups, and training materials needing clean data visualization aesthetic.
Powered by 


0
downloads
downloads
Tags:
More
Credit Photo
If you would like to credit the Photo, here are some ways you can do so
Text Link
photo Link
<span class="text-link">
<span>
<a target="_blank" href=https://pikwizard.com/photo/visualizing-financial-data-with-multicolored-candlestick-bars-trend-lines-and-watercolor-grid/d35fa2bab94c849f91b4fa72c579bd37/>PikWizard</a>
</span>
</span>
<span class="image-link">
<span
style="margin: 0 0 20px 0; display: inline-block; vertical-align: middle; width: 100%;"
>
<a
target="_blank"
href="https://pikwizard.com/photo/visualizing-financial-data-with-multicolored-candlestick-bars-trend-lines-and-watercolor-grid/d35fa2bab94c849f91b4fa72c579bd37/"
style="text-decoration: none; font-size: 10px; margin: 0;"
>
<img src="https://pikwizard.com/pw/medium/d35fa2bab94c849f91b4fa72c579bd37.jpg" style="margin: 0; width: 100%;" alt="" />
<p style="font-size: 12px; margin: 0;">PikWizard</p>
</a>
</span>
</span>
Free (free of charge)
Free for personal and commercial use.
Author: Awesome Content
Similar Free Stock Images

Premium


Premium


Premium


Premium


Premium


Premium


Premium


Premium


Premium


Premium


Premium


Premium


Premium


Premium


Premium


Premium


Premium


Premium


Premium


Premium


Premium


Premium


Premium


Premium