- Home >
- Stock Photos >
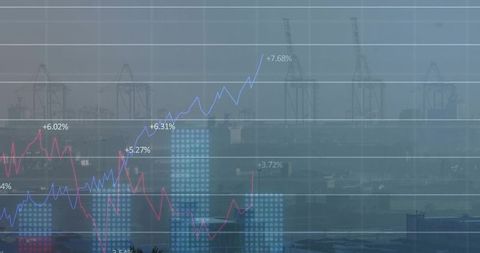
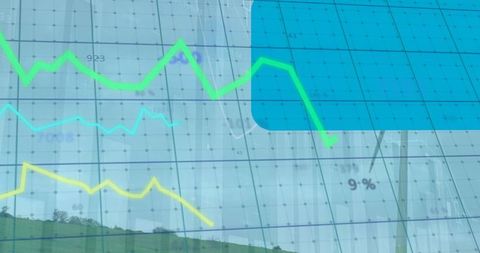
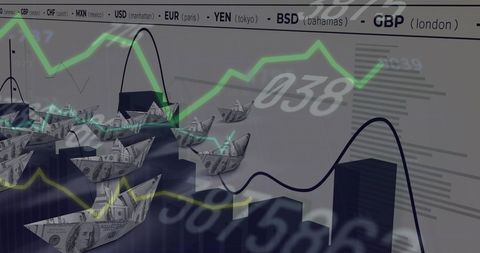
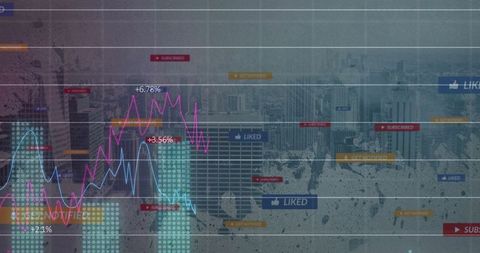
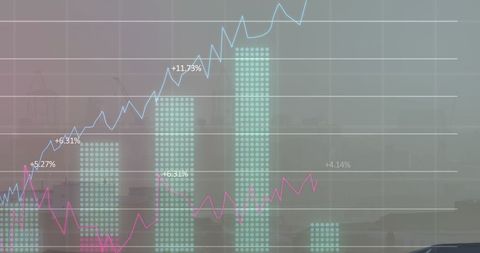
- Visualizing Financial Growth with Red Arrow and Data Graphs
Visualizing Financial Growth with Red Arrow and Data Graphs Image
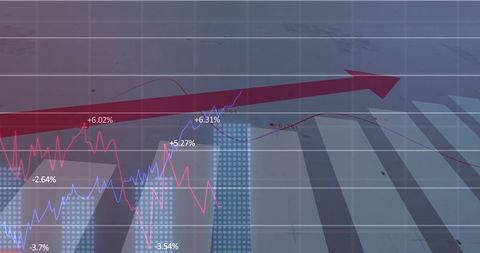
Abstract design showing financial data visualization with a prominent red arrow and various chart components. Used for illustrating market growth, economic trends, or business analytics. Ideal for business presentations, educational infographics, or reports featuring data analysis and economic progress.

downloads
Tags:
More
Credit Photo
If you would like to credit the Photo, here are some ways you can do so
Text Link
photo Link
<span class="text-link">
<span>
<a target="_blank" href=https://pikwizard.com/photo/visualizing-financial-growth-with-red-arrow-and-data-graphs/066b148e58fb2f9781562cfecfc03d96/>PikWizard</a>
</span>
</span>
<span class="image-link">
<span
style="margin: 0 0 20px 0; display: inline-block; vertical-align: middle; width: 100%;"
>
<a
target="_blank"
href="https://pikwizard.com/photo/visualizing-financial-growth-with-red-arrow-and-data-graphs/066b148e58fb2f9781562cfecfc03d96/"
style="text-decoration: none; font-size: 10px; margin: 0;"
>
<img src="https://pikwizard.com/pw/medium/066b148e58fb2f9781562cfecfc03d96.jpg" style="margin: 0; width: 100%;" alt="" />
<p style="font-size: 12px; margin: 0;">PikWizard</p>
</a>
</span>
</span>
Free (free of charge)
Free for personal and commercial use.
Author: People Creations