
- Home >
- Stock Photos >
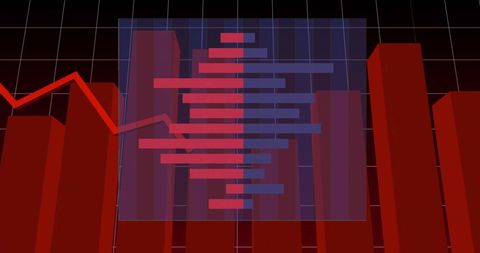
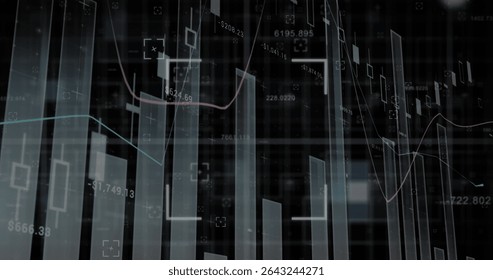
- Visualizing Financial Trends on Digital Grid Background
Visualizing Financial Trends on Digital Grid Background Image

Depicting a red and orange bar and line graph seamlessly integrating with grid design. Tiny dynamic movements illustrate active data processing, ideal for illustrating concepts like economic trends, business reports, web interfaces. Especially suitable for economic blogs, statistical analysis teaching materials, financial web platforms, digital publication visuals, emphasizing progress and analysis.
Powered by  - Get 15% off with code: PIKWIZARD15


downloads
Tags:
More
Credit Photo
If you would like to credit the Photo, here are some ways you can do so
Text Link
photo Link
<span class="text-link">
<span>
<a target="_blank" href=https://pikwizard.com/photo/visualizing-financial-trends-on-digital-grid-background/10aa7cb0d527bb364f43830bd249a003/>PikWizard</a>
</span>
</span>
<span class="image-link">
<span
style="margin: 0 0 20px 0; display: inline-block; vertical-align: middle; width: 100%;"
>
<a
target="_blank"
href="https://pikwizard.com/photo/visualizing-financial-trends-on-digital-grid-background/10aa7cb0d527bb364f43830bd249a003/"
style="text-decoration: none; font-size: 10px; margin: 0;"
>
<img src="https://pikwizard.com/pw/medium/10aa7cb0d527bb364f43830bd249a003.jpg" style="margin: 0; width: 100%;" alt="" />
<p style="font-size: 12px; margin: 0;">PikWizard</p>
</a>
</span>
</span>
Free (free of charge)
Free for personal and commercial use.
Author: Authentic Images
Similar Free Stock Images

Premium


Premium


Premium


Premium


Premium


Premium


Premium


Premium


Premium


Premium


Premium


Premium


Premium


Premium

Premium


Premium


Premium


Premium


Premium

Premium


Premium


Premium


Premium


Premium


Premium


Explore More Free Stock Images