- Home >
- Stock Photos >
- Visualizing Futuristic Data Dashboard Showing Interactive Analytics and Financial Trends
Visualizing Futuristic Data Dashboard Showing Interactive Analytics and Financial Trends Image

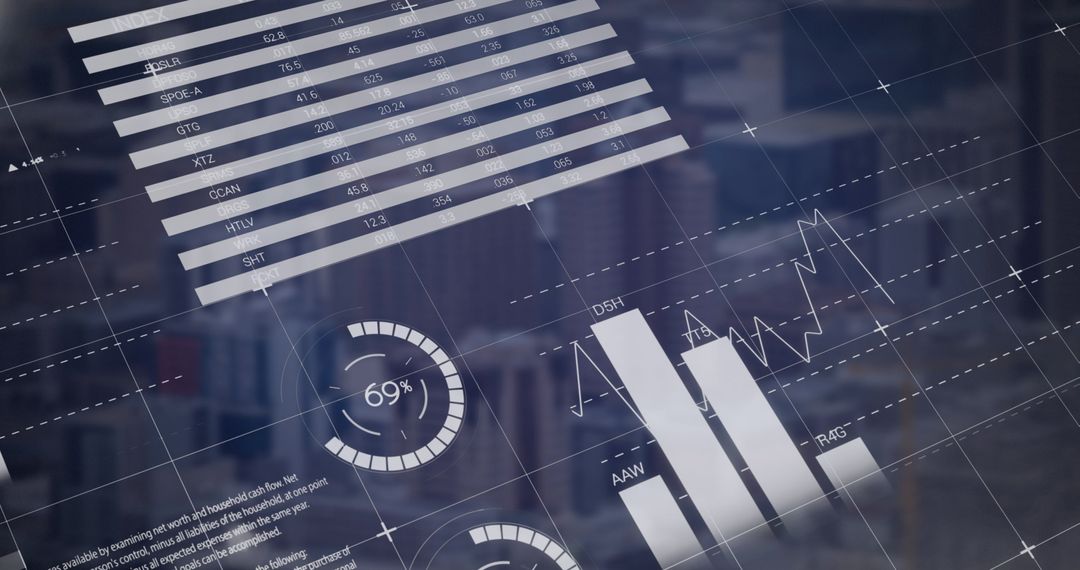
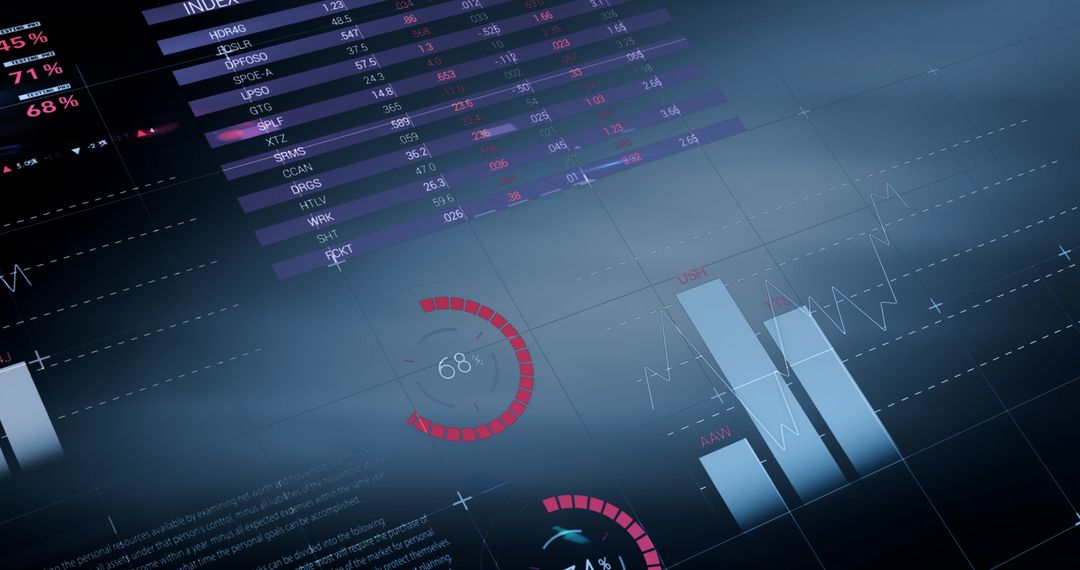
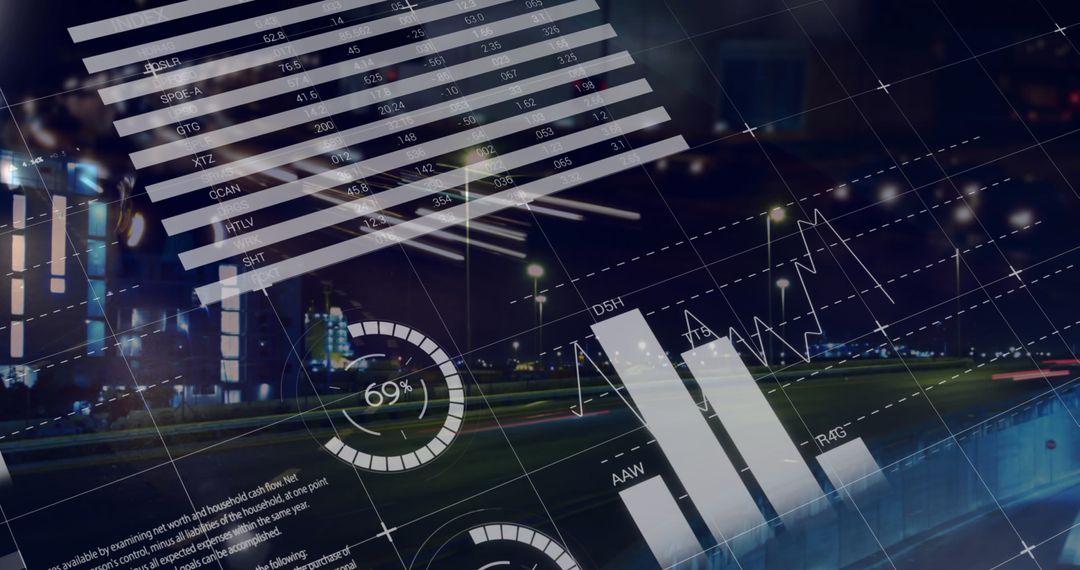
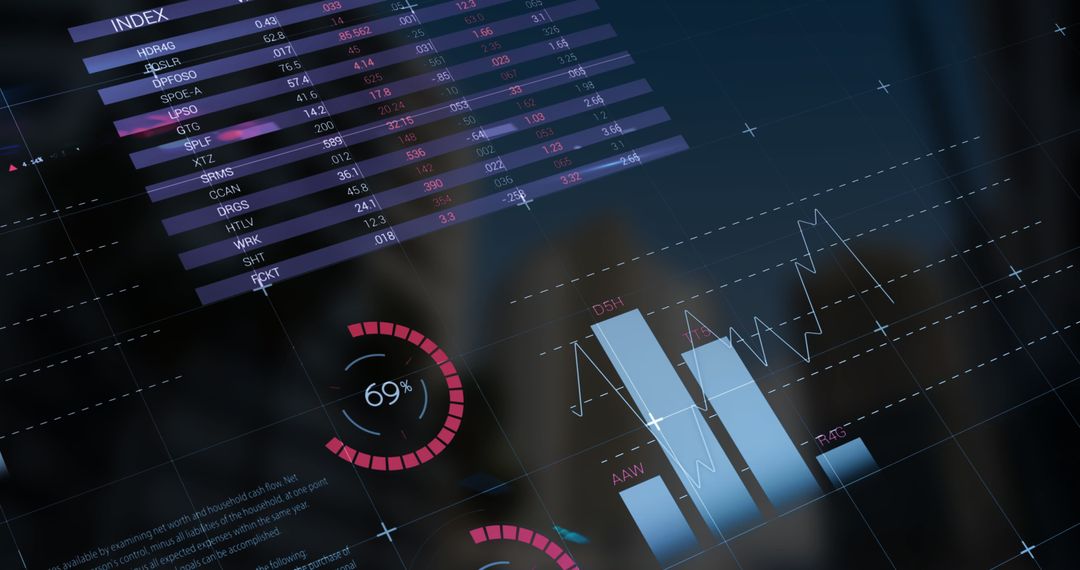
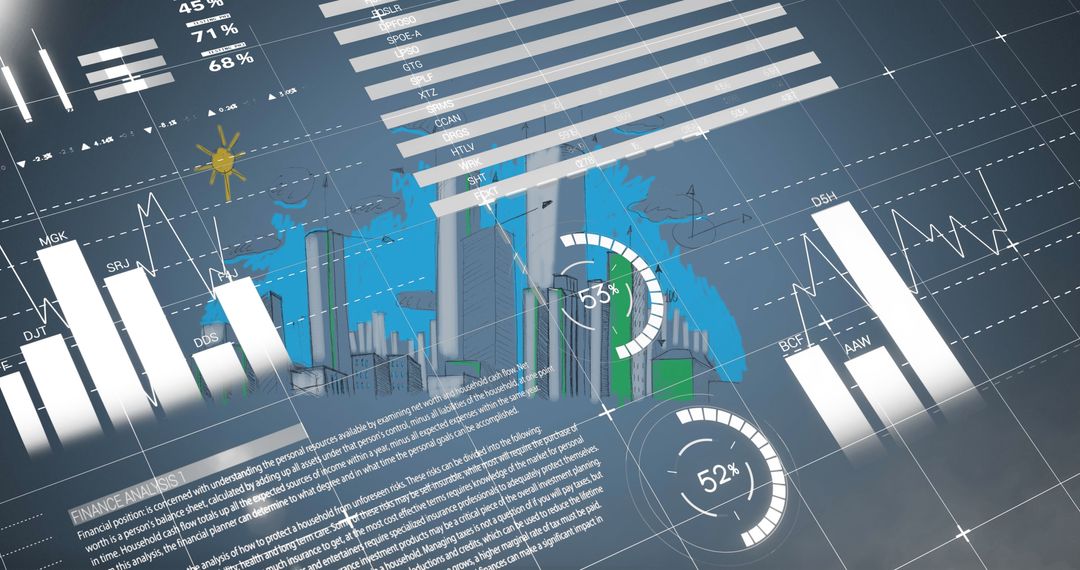
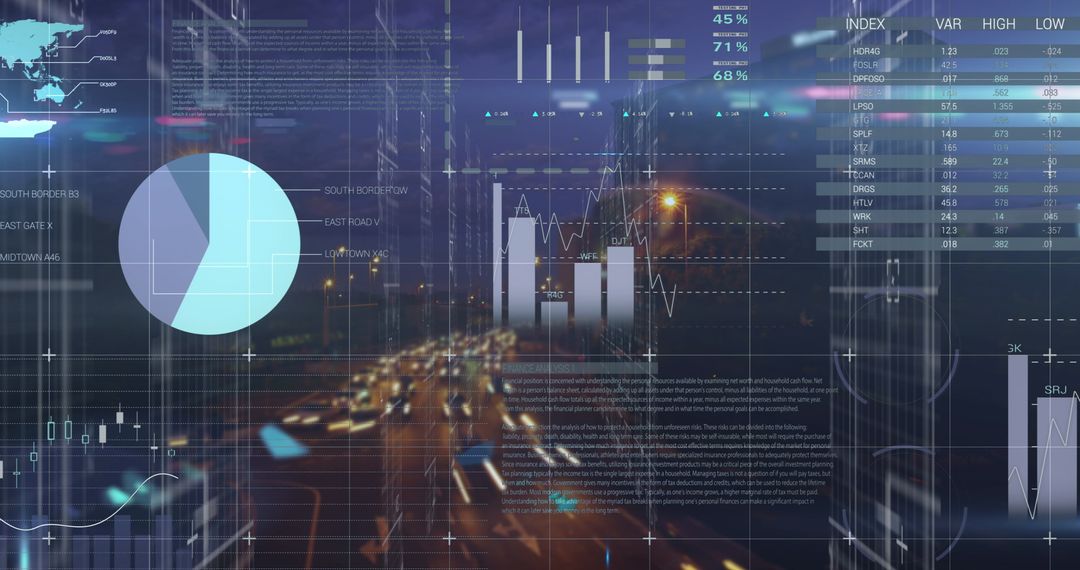
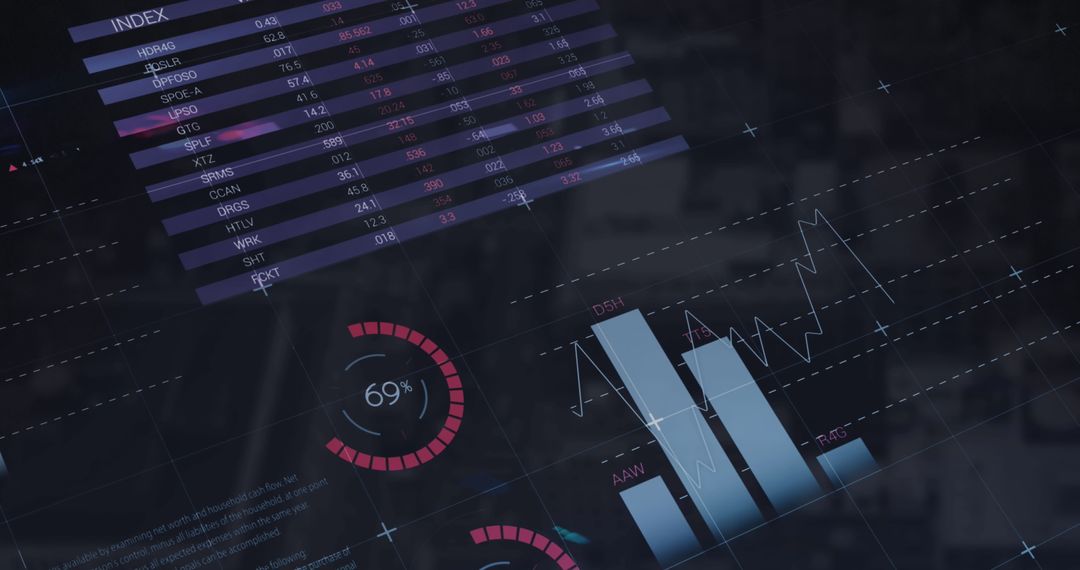
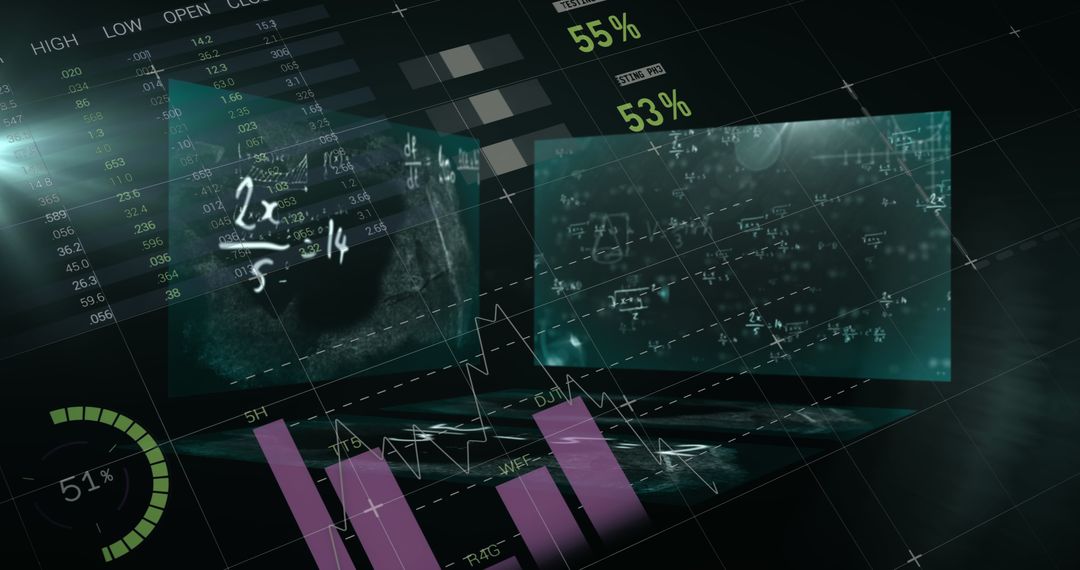
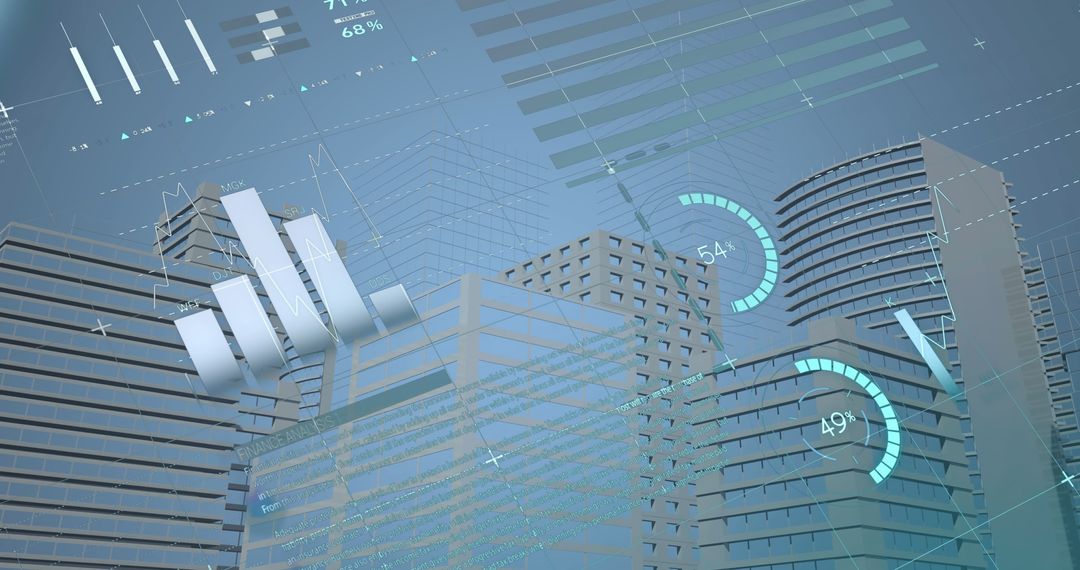
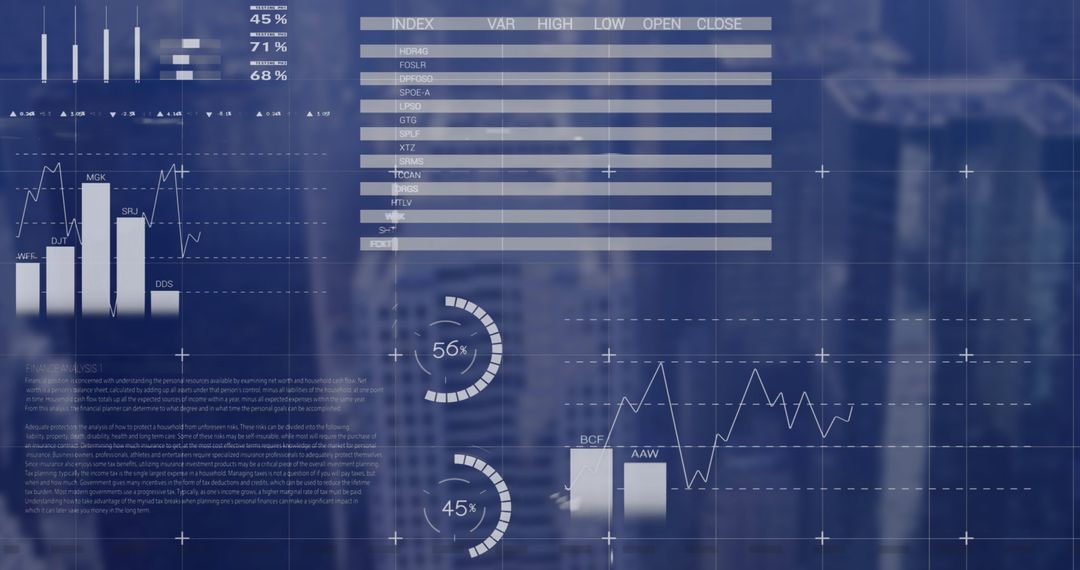
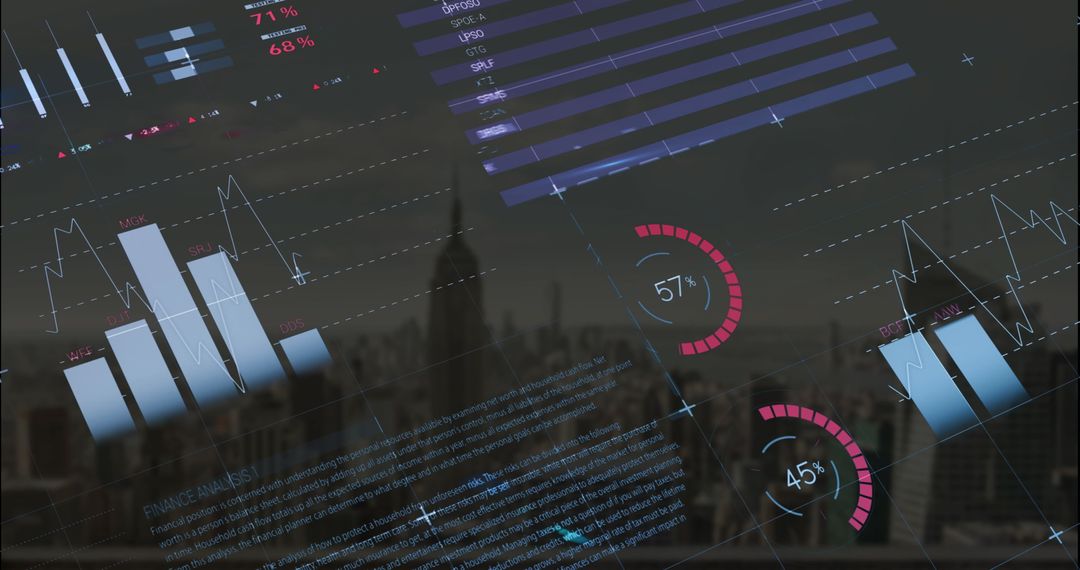
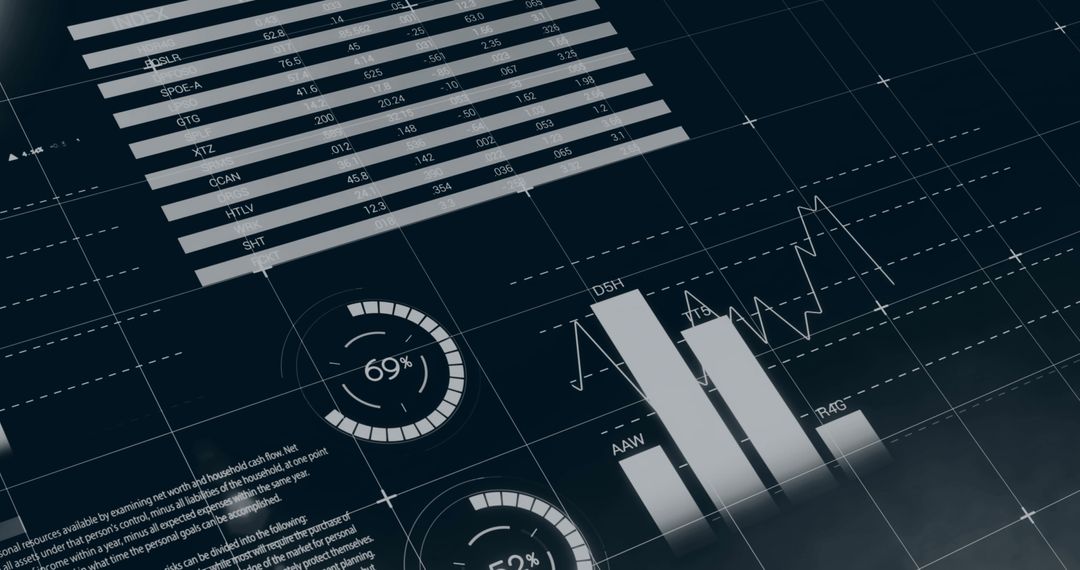
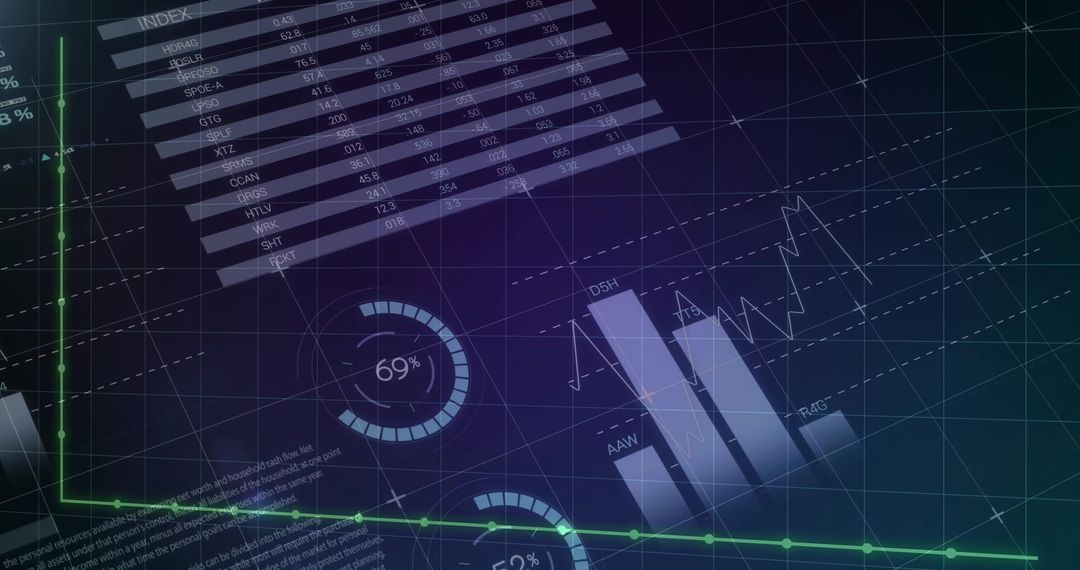
Featuring layered HUD panels, translucent grid overlay, vertical bar charts, circular progress gauges showing 69% and multiple line charts with candlestick hints. Combining teal-blue color palette with subtle circuit textures for modern tech and finance mood. Providing wide aspect ratio and negative space for headline and CTA placement, allowing easy cropping for banners or social posts. Serving for fintech presentations, investor reports, business intelligence dashboards, startup pitch decks, data science blogs, and marketing collateral. Applying as background for slide decks, hero banners, UI mockups, annual reports, app onboarding screens, and video overlays. Allowing color and text customization for branding and messaging.
Powered by  - Get 15% off with code: PIKWIZARD15


0
downloads
downloads
Tags:
More
Credit Photo
If you would like to credit the Photo, here are some ways you can do so
Text Link
photo Link
<span class="text-link">
<span>
<a target="_blank" href=https://pikwizard.com/photo/visualizing-futuristic-data-dashboard-showing-interactive-analytics-and-financial-trends/37b7a9090c74fbdf6c97d65f19ac53a6/>PikWizard</a>
</span>
</span>
<span class="image-link">
<span
style="margin: 0 0 20px 0; display: inline-block; vertical-align: middle; width: 100%;"
>
<a
target="_blank"
href="https://pikwizard.com/photo/visualizing-futuristic-data-dashboard-showing-interactive-analytics-and-financial-trends/37b7a9090c74fbdf6c97d65f19ac53a6/"
style="text-decoration: none; font-size: 10px; margin: 0;"
>
<img src="https://pikwizard.com/pw/medium/37b7a9090c74fbdf6c97d65f19ac53a6.jpg" style="margin: 0; width: 100%;" alt="" />
<p style="font-size: 12px; margin: 0;">PikWizard</p>
</a>
</span>
</span>
Free (free of charge)
Free for personal and commercial use.
Author: Authentic Images
Similar Free Stock Images
Premium


Premium


Premium


Premium


Premium


Premium


Premium


Premium


Premium


Premium


Premium


Premium


Premium


Premium


Premium


Premium


Premium


Premium


Premium


Premium


Premium


Premium


Premium


Premium