- Home >
- Stock Photos >
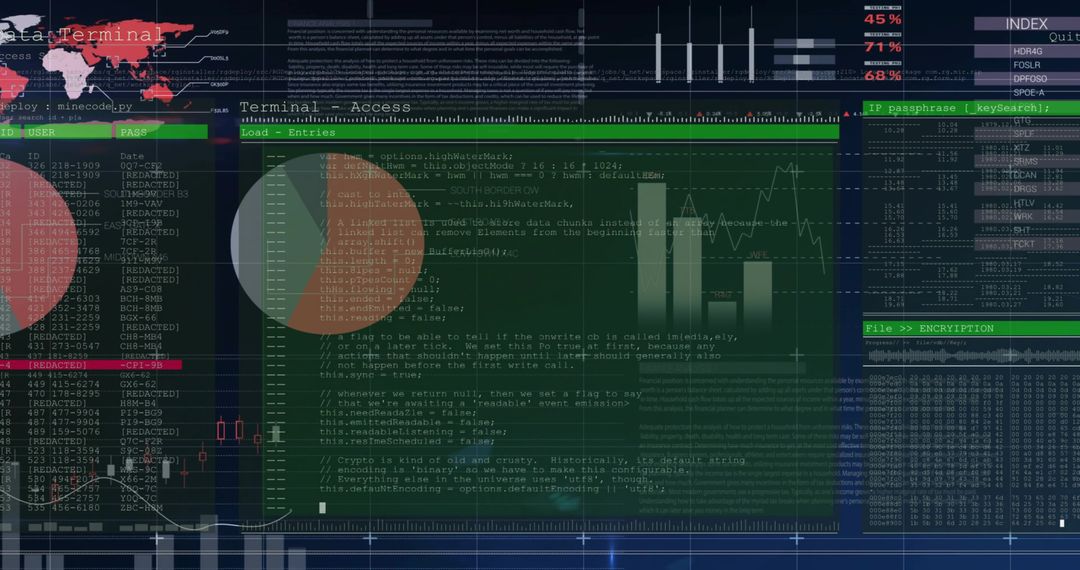
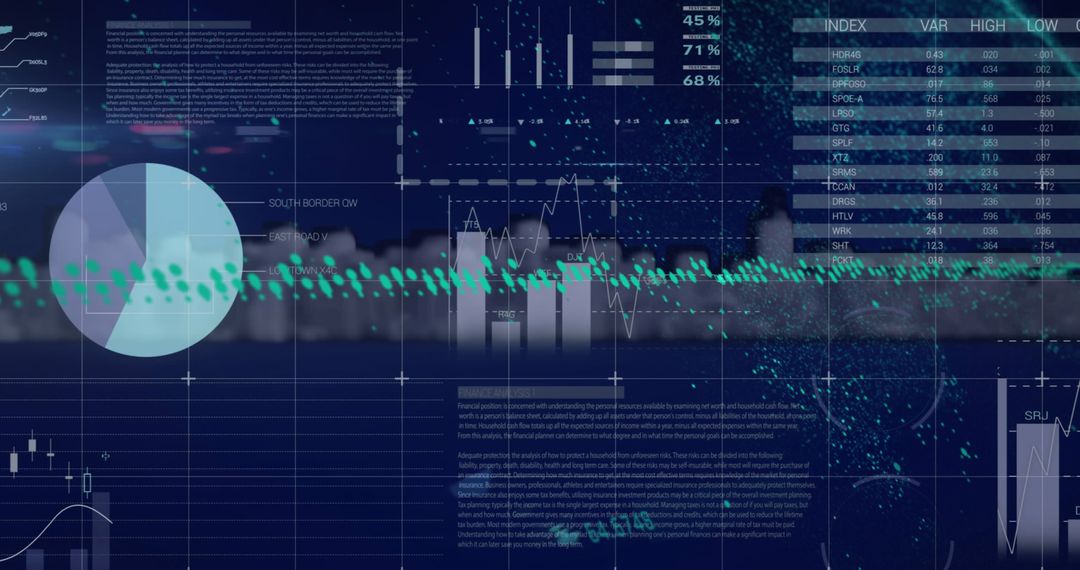
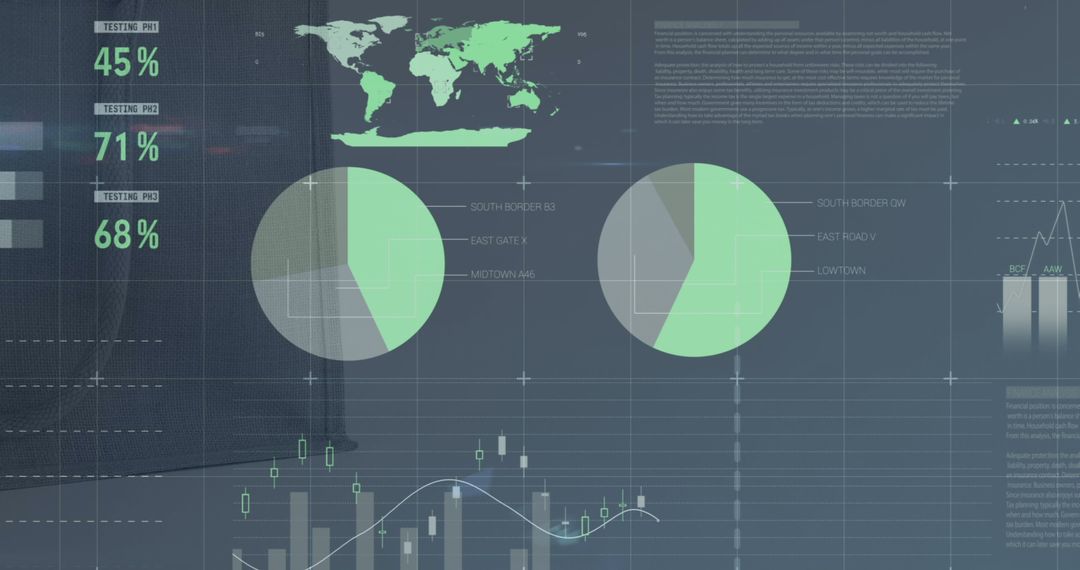
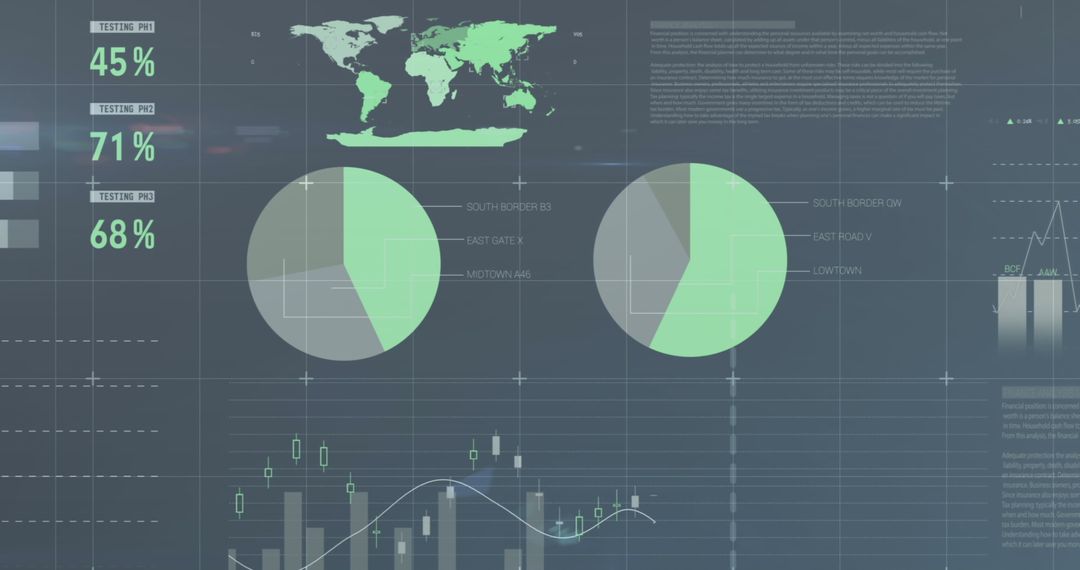
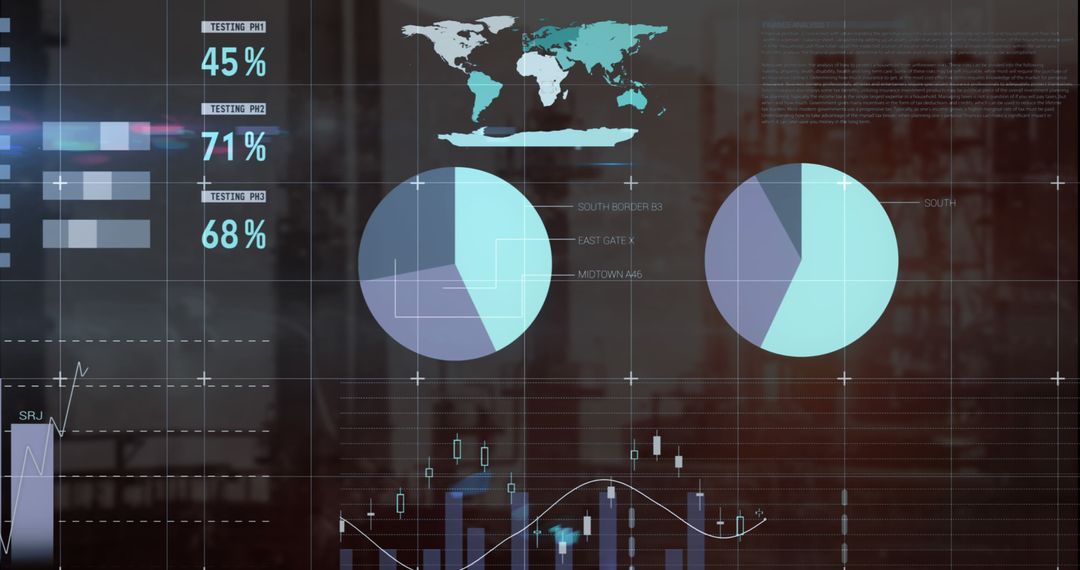
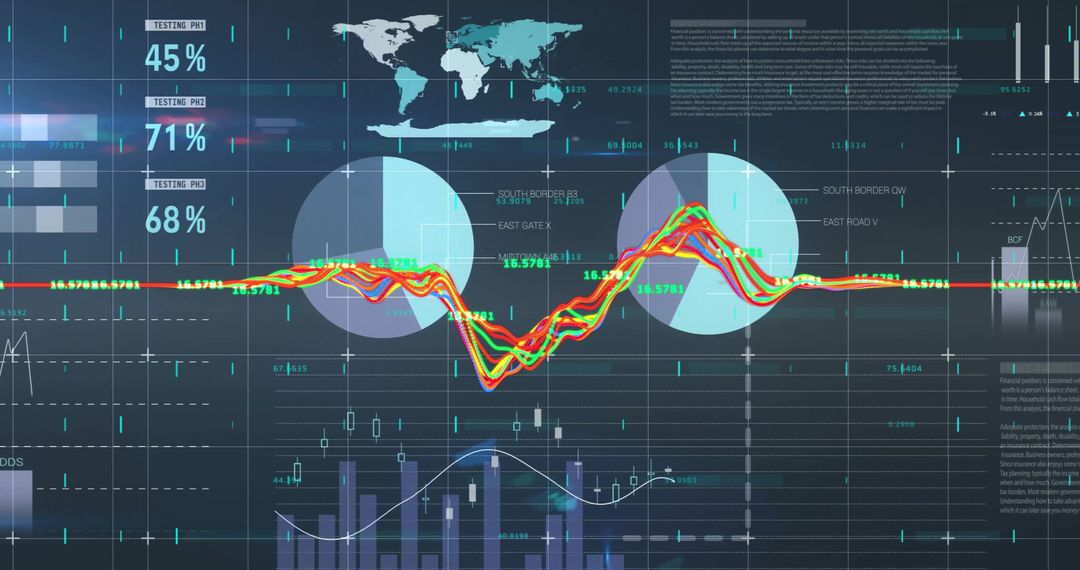
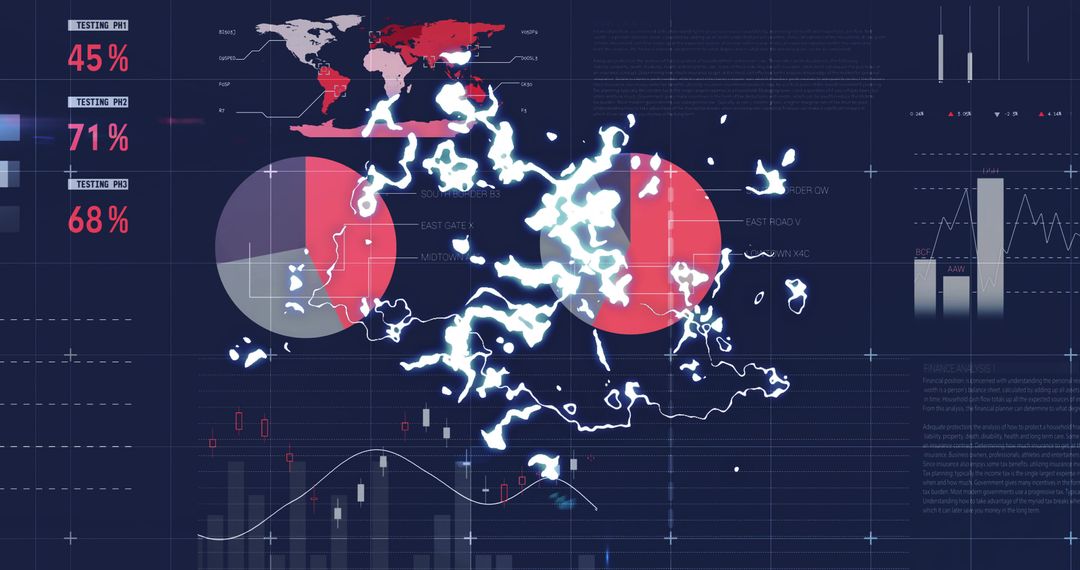
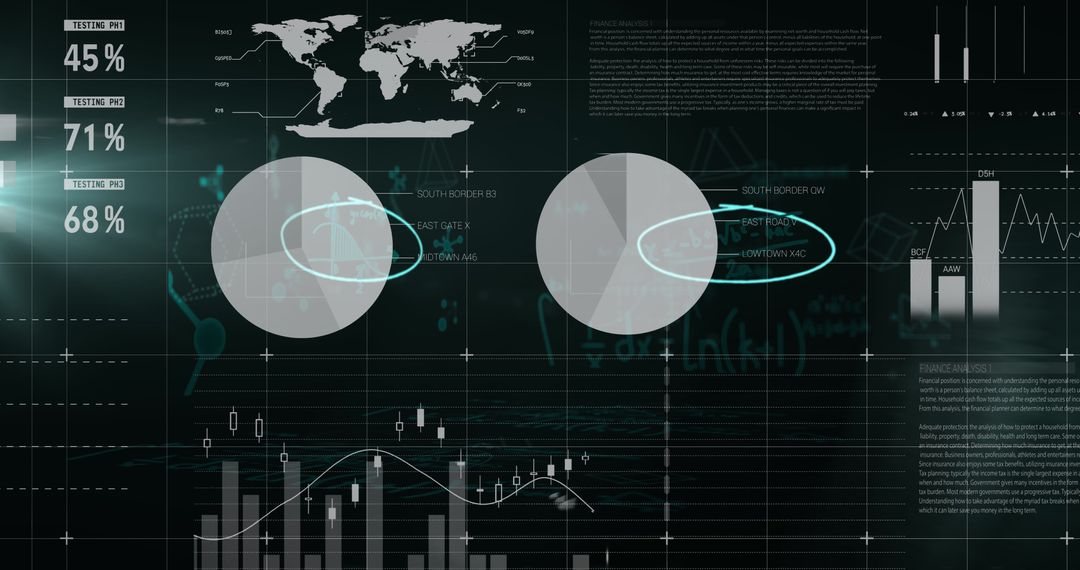
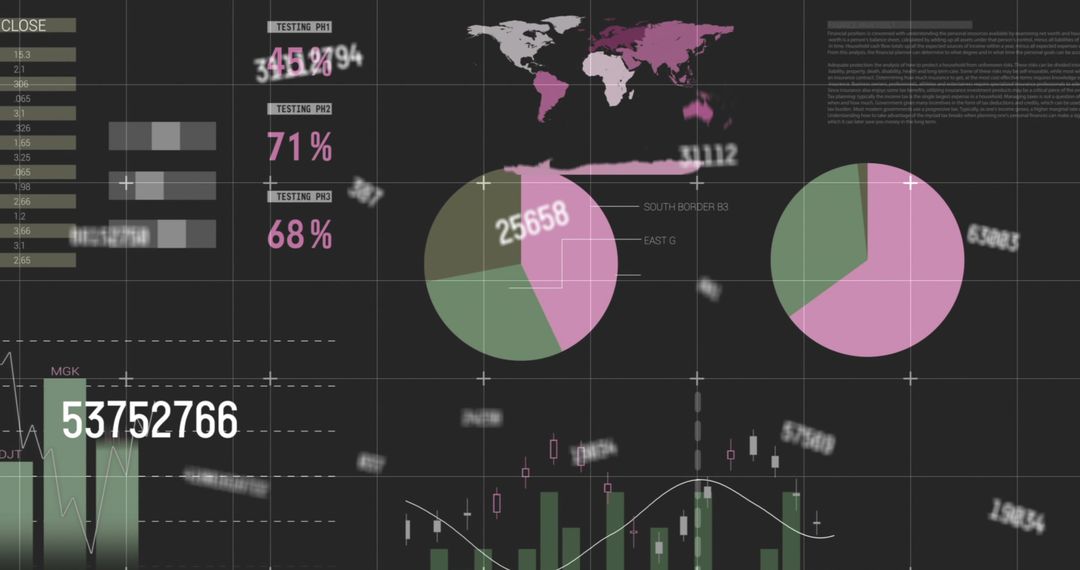
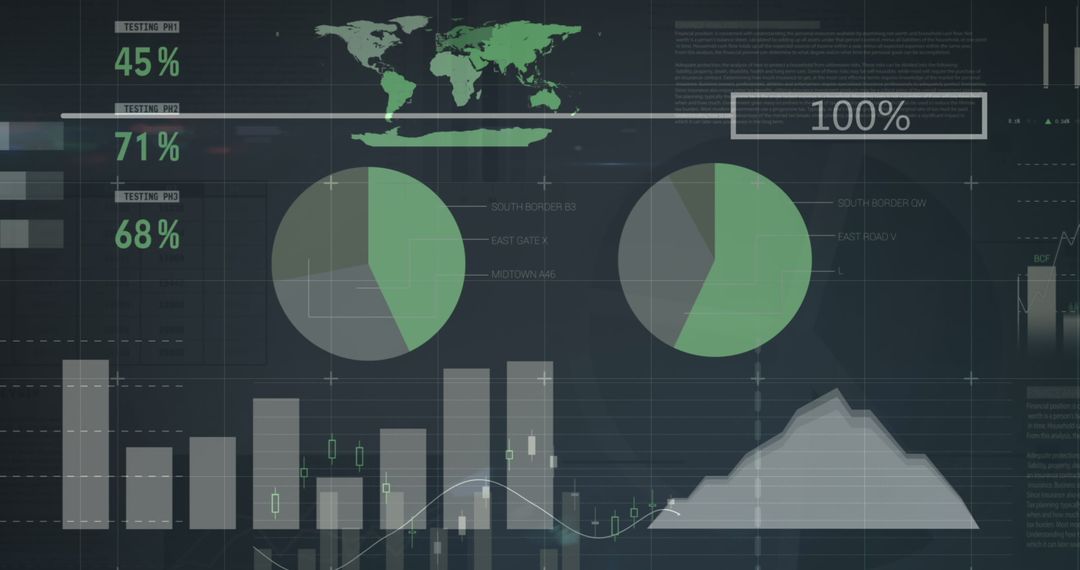
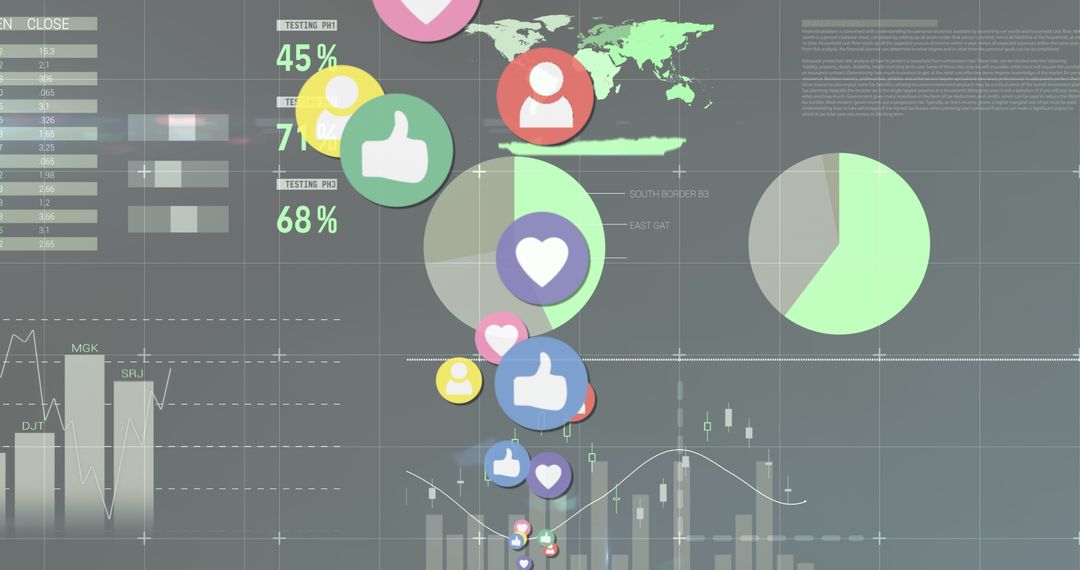
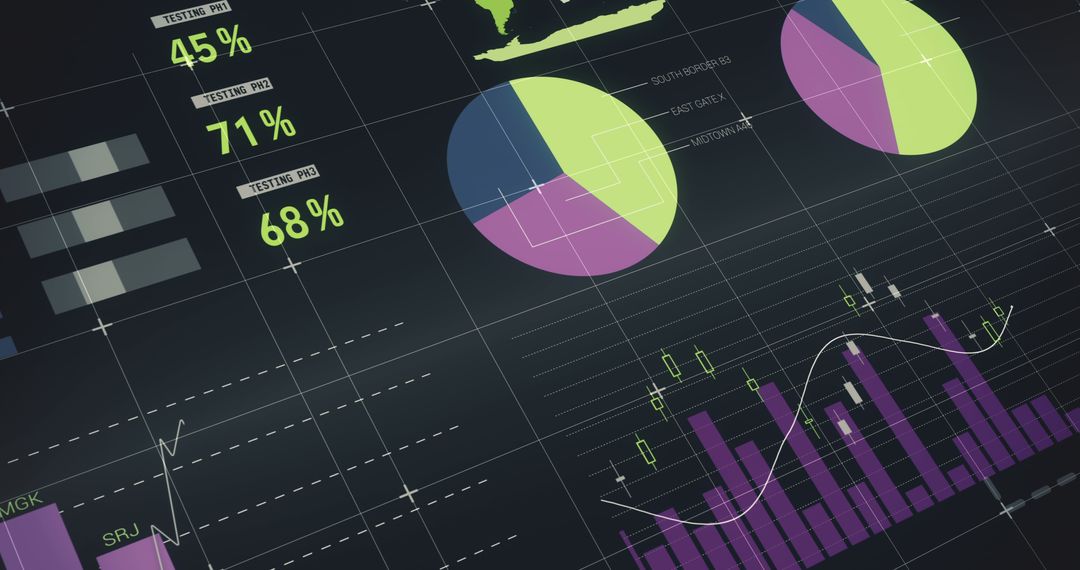
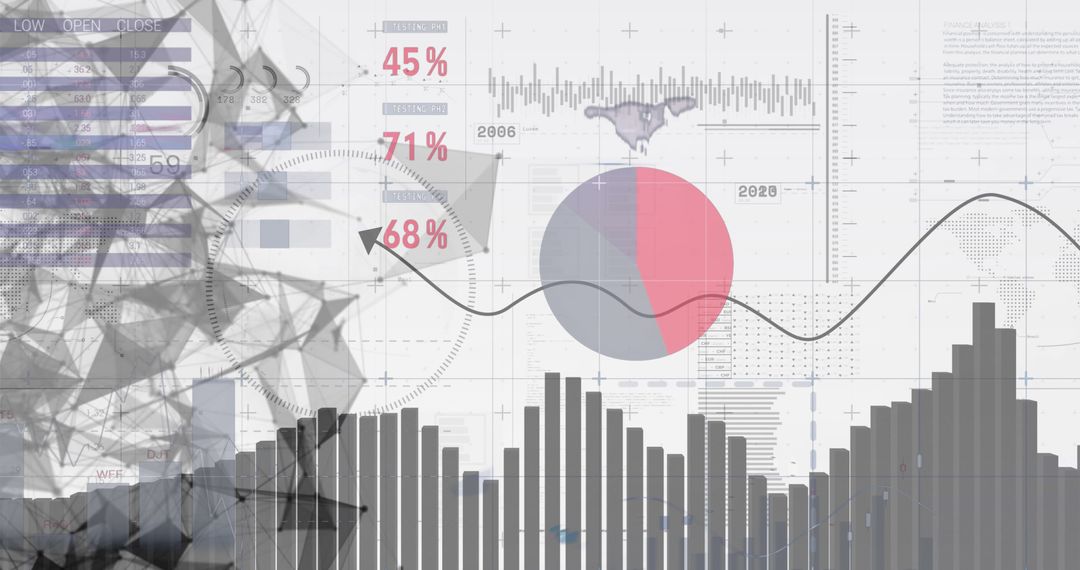
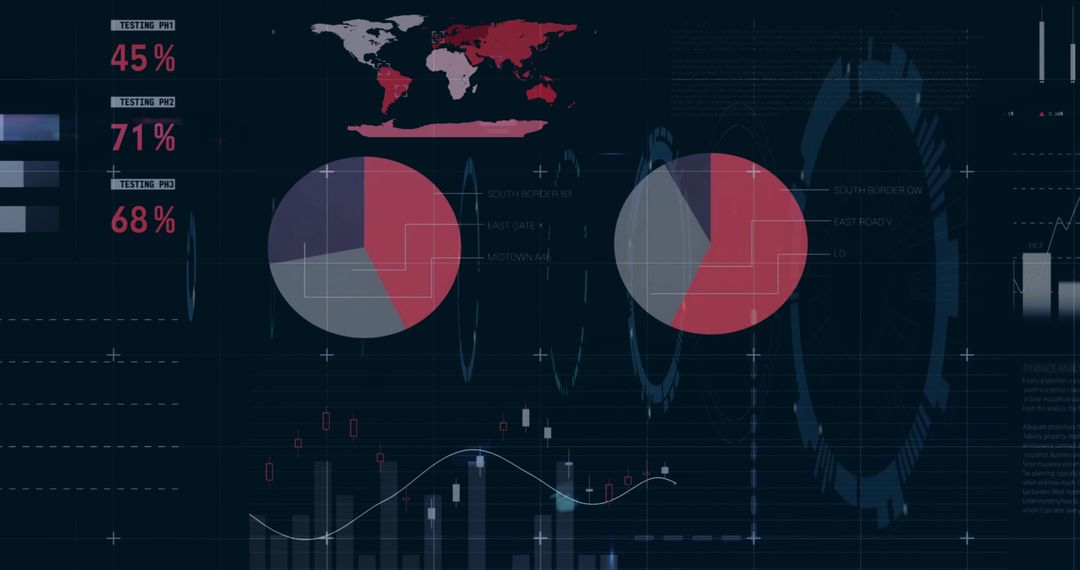
- Visualizing futuristic neon data dashboard with global analytics, pie charts, candlesticks
Visualizing futuristic neon data dashboard with global analytics, pie charts, candlesticks Image

Showing neon green world map, dual pie charts, waveform, candlestick and bar graphs over dark gridlines for high-tech data presentation. Featuring HUD-style overlays, percentage metrics (45%, 71%, 68%) and subtle text blocks for contextual detail. Supporting fintech, trading, market analysis, cybersecurity dashboards, business reports and technology editorials. Working well as website hero banner, slide deck background, data-driven blog header, annual report graphic, social media campaign visual and conference promotional material. Allowing designers to crop, color-grade, animate or layer elements for headline sequences, explainer videos, interactive UI mockups and product demos.
Powered by  - Get 15% off with code: PIKWIZARD15


0
downloads
downloads
Tags:
More
Credit Photo
If you would like to credit the Photo, here are some ways you can do so
Text Link
photo Link
<span class="text-link">
<span>
<a target="_blank" href=https://pikwizard.com/photo/visualizing-futuristic-neon-data-dashboard-with-global-analytics-pie-charts-candlesticks/e5f579879ece4a4cce142af473dfc338/>PikWizard</a>
</span>
</span>
<span class="image-link">
<span
style="margin: 0 0 20px 0; display: inline-block; vertical-align: middle; width: 100%;"
>
<a
target="_blank"
href="https://pikwizard.com/photo/visualizing-futuristic-neon-data-dashboard-with-global-analytics-pie-charts-candlesticks/e5f579879ece4a4cce142af473dfc338/"
style="text-decoration: none; font-size: 10px; margin: 0;"
>
<img src="https://pikwizard.com/pw/medium/e5f579879ece4a4cce142af473dfc338.jpg" style="margin: 0; width: 100%;" alt="" />
<p style="font-size: 12px; margin: 0;">PikWizard</p>
</a>
</span>
</span>
Free (free of charge)
Free for personal and commercial use.
Author: Creative Art
Similar Free Stock Images

Premium


Premium


Premium

Premium


Premium


Premium


Premium


Premium


Premium


Premium


Premium


Premium


Premium


Premium


Premium


Premium


Premium


Premium


Premium


Premium


Premium


Premium


Premium

Premium