- Home >
- Stock Photos >
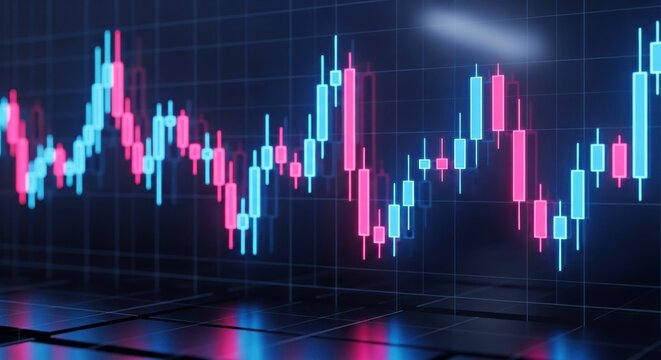
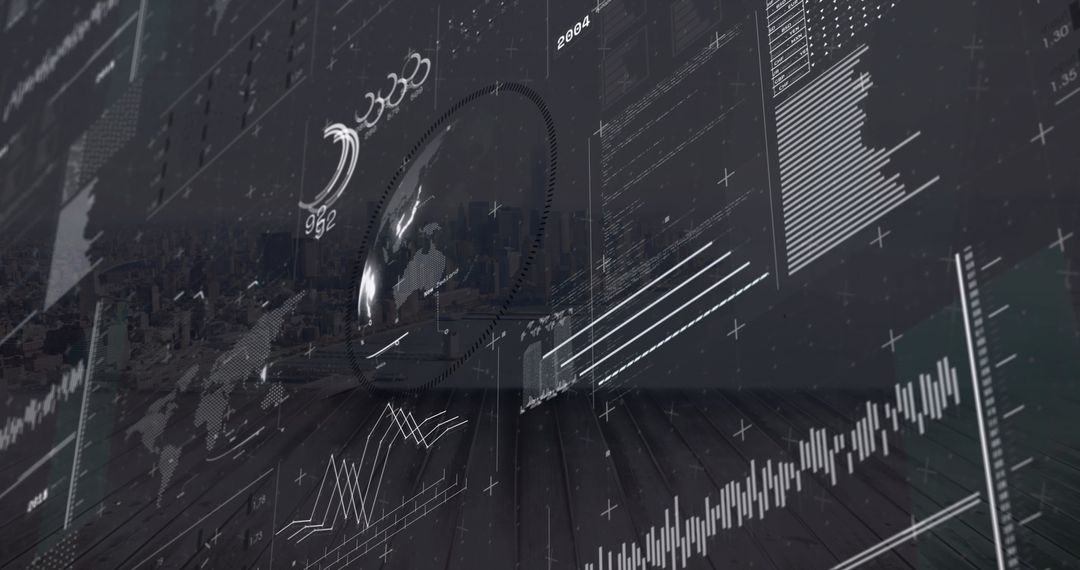
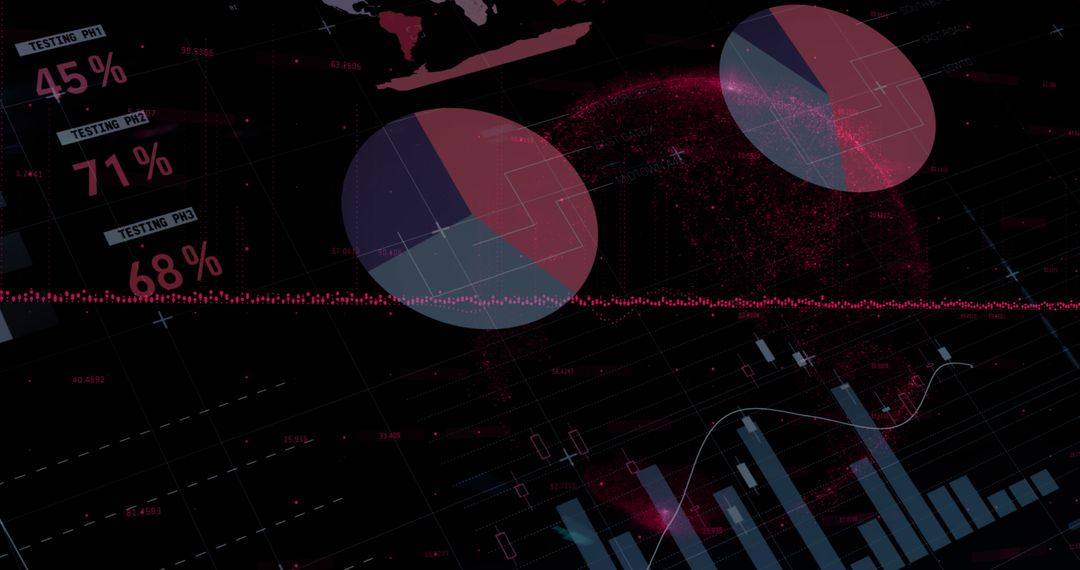
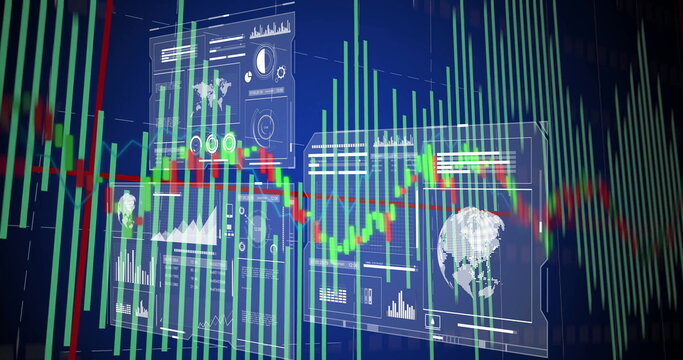
- Visualizing Global Financial Data with Neon Magenta Ribbons and Candlestick Charts
Visualizing Global Financial Data with Neon Magenta Ribbons and Candlestick Charts Image

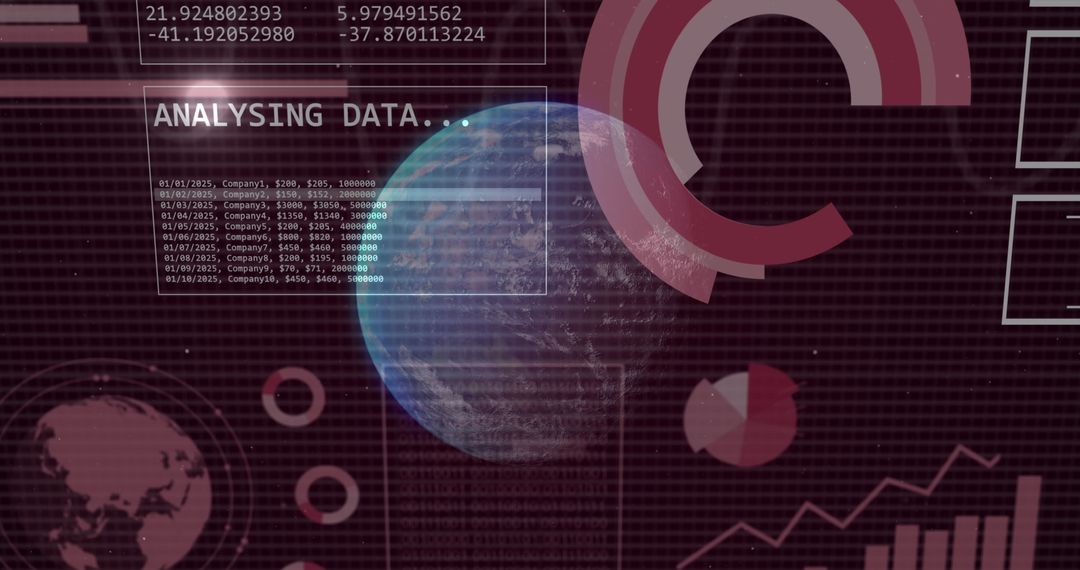
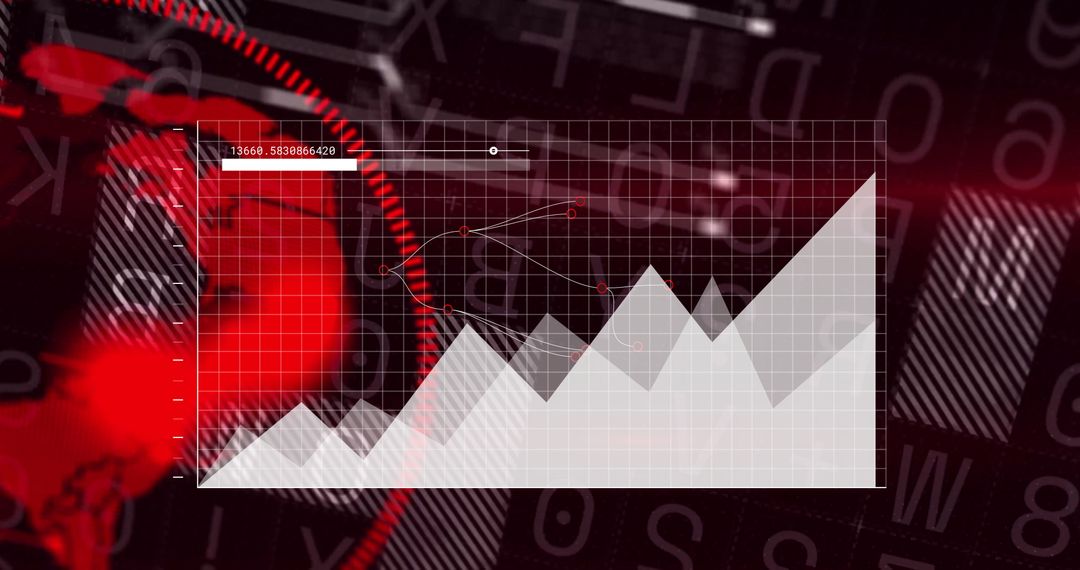
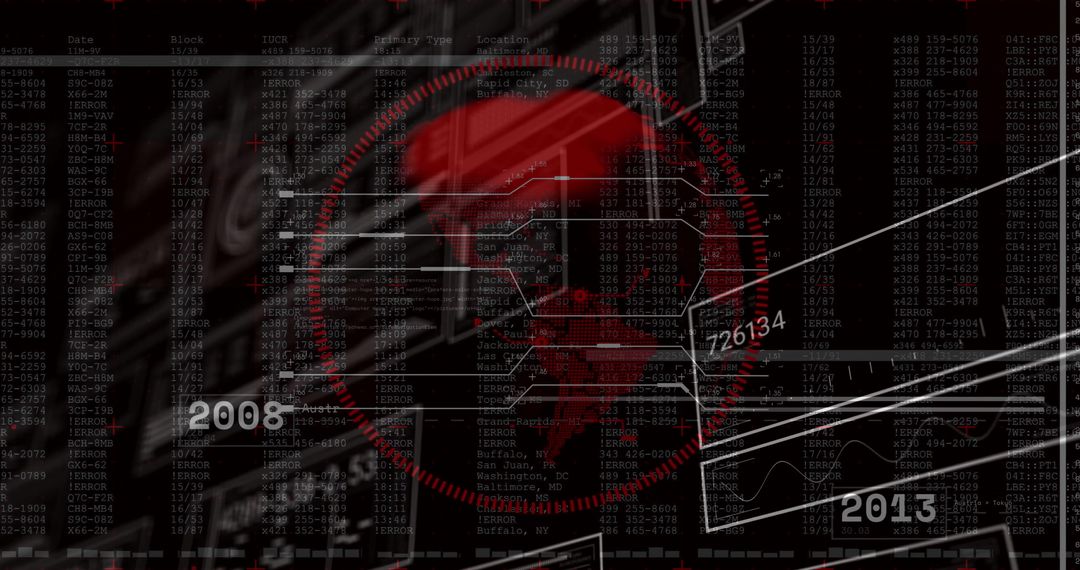
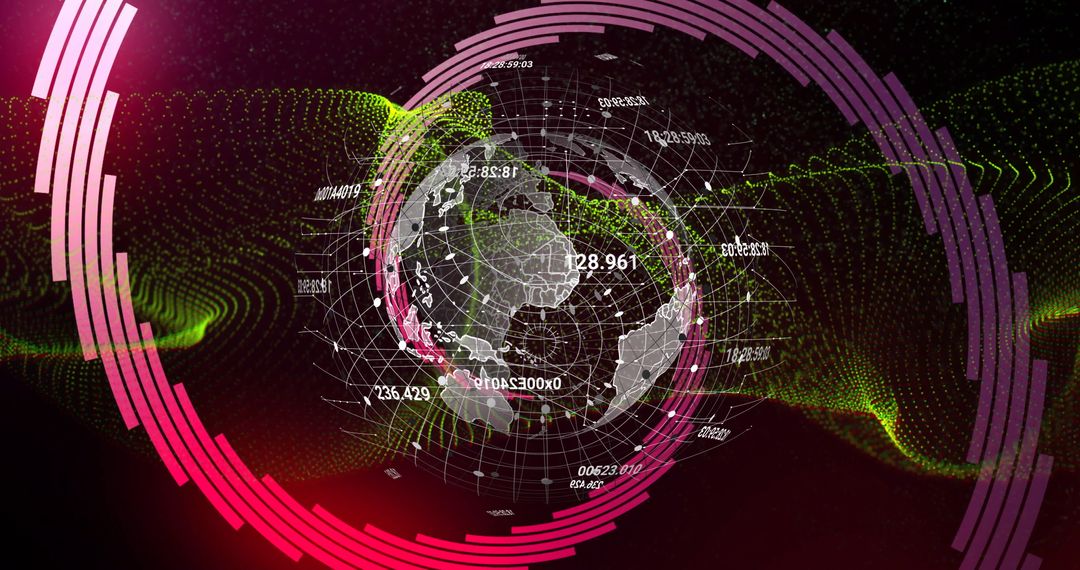
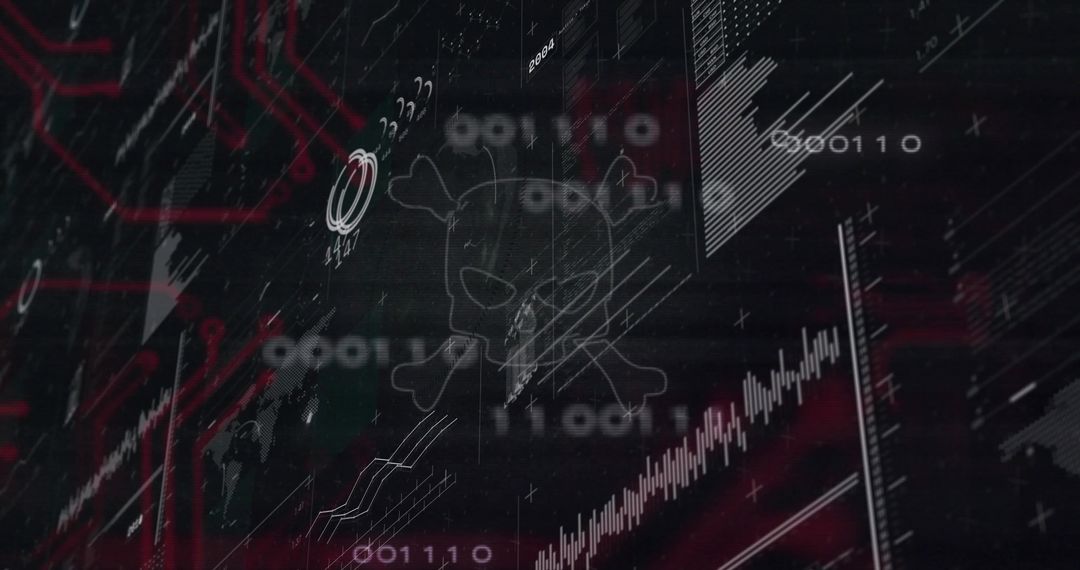
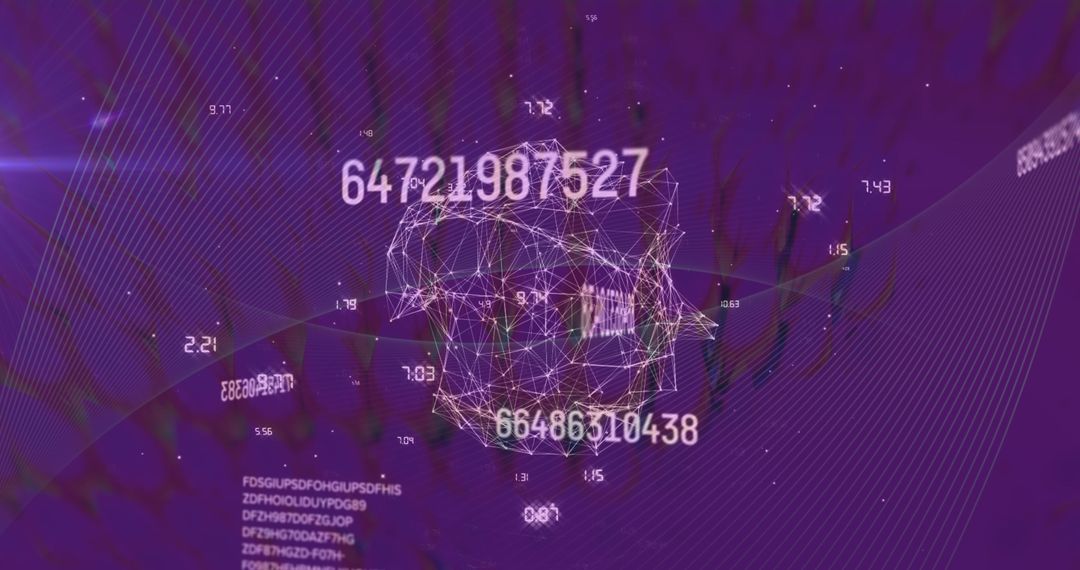
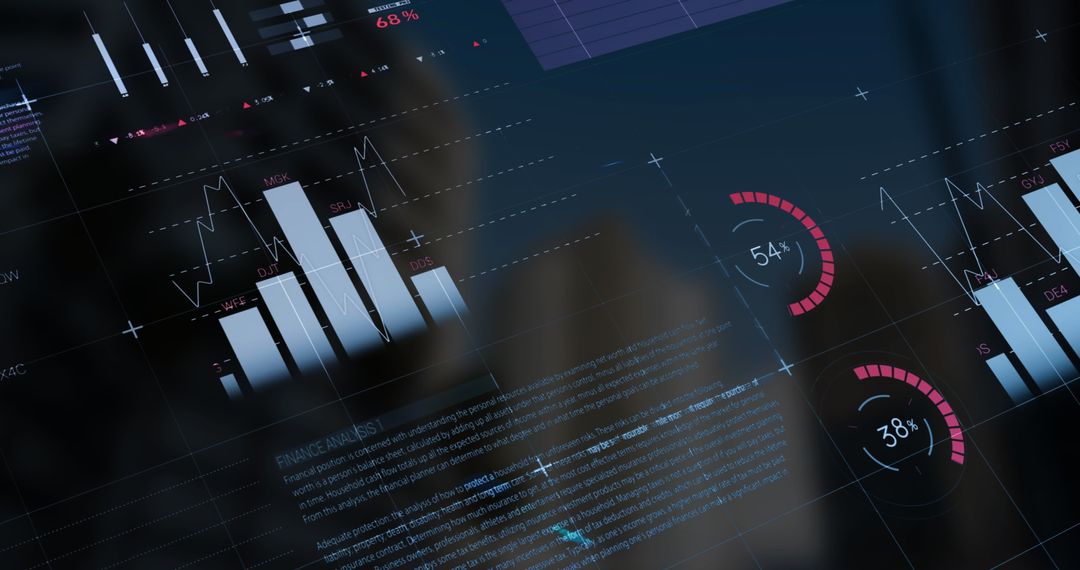
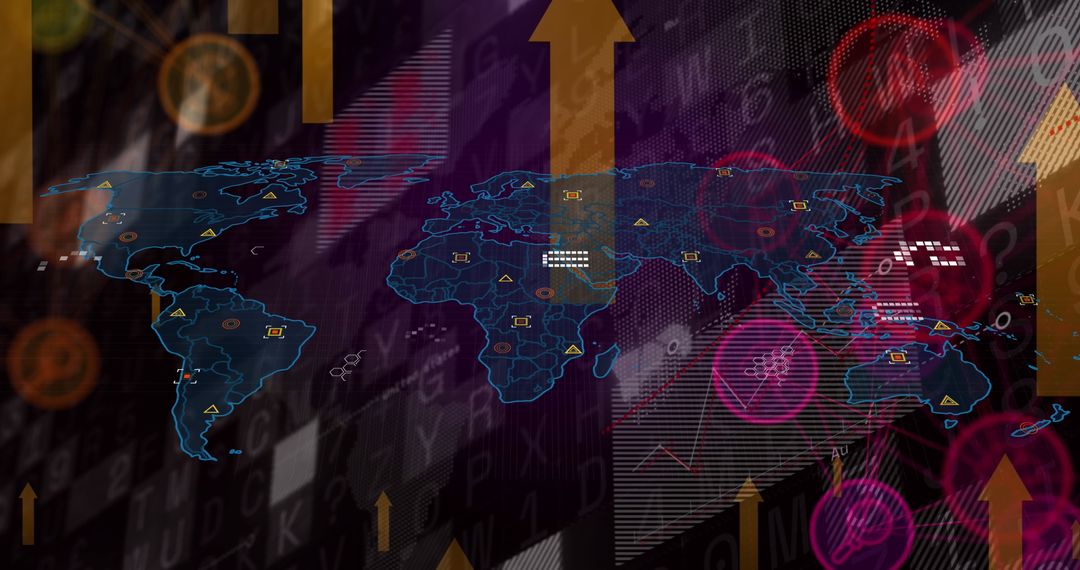
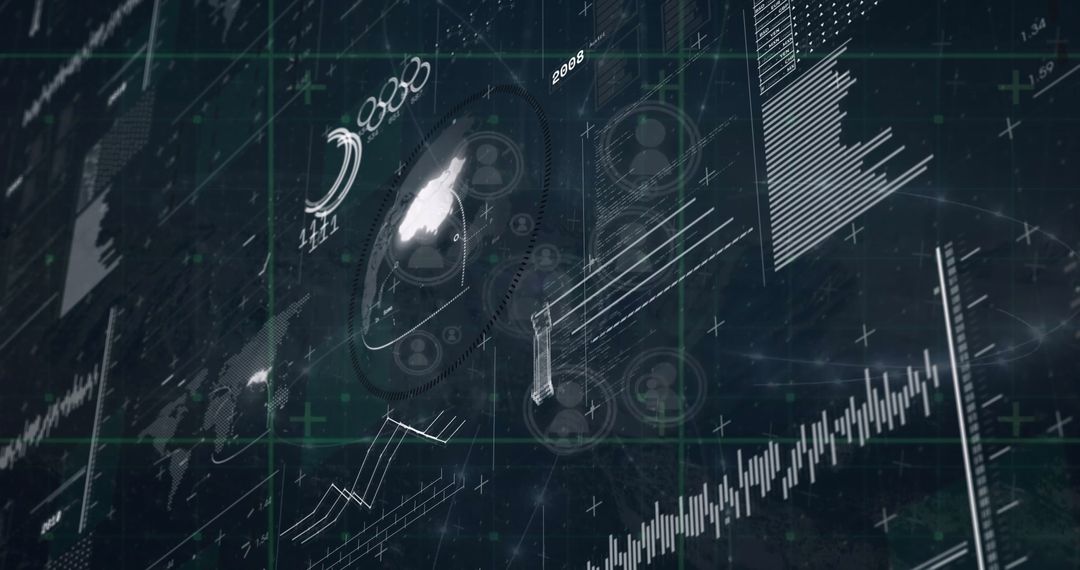
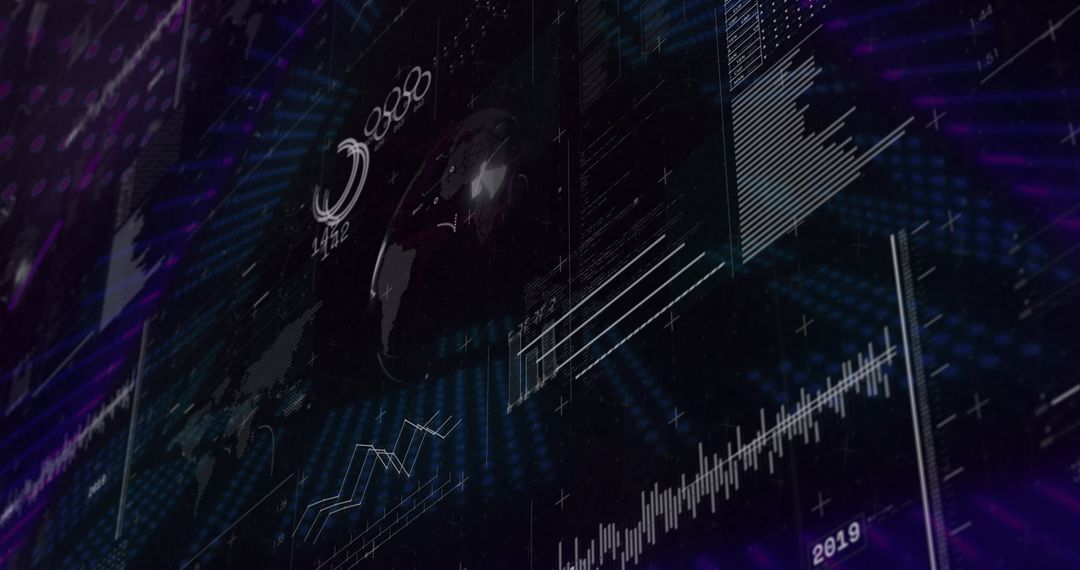
Dark futuristic dashboard showing neon magenta ribbons weaving through candlestick charts, bar graphs, globe silhouette, and gauge overlays. Composition featuring central globe with diagonal data streams and grid overlays creating sense of motion and depth. Color palette using deep blacks, magenta, purple, and red highlights for high-contrast, energetic mood. Ideal for fintech, cryptocurrency, stock market, data analytics, and tech branding. Use for website hero, blog header, presentation slide, report cover, app background, advertising for trading platforms, UI mockups, video overlays, or social media posts. High-contrast cinematic look working well with large typography and overlay text; crop-friendly for banner or square formats.
Powered by 


0
downloads
downloads
Tags:
More
Credit Photo
If you would like to credit the Photo, here are some ways you can do so
Text Link
photo Link
<span class="text-link">
<span>
<a target="_blank" href=https://pikwizard.com/photo/visualizing-global-financial-data-with-neon-magenta-ribbons-and-candlestick-charts/2e0b06e12bd2c26901951e5d46643652/>PikWizard</a>
</span>
</span>
<span class="image-link">
<span
style="margin: 0 0 20px 0; display: inline-block; vertical-align: middle; width: 100%;"
>
<a
target="_blank"
href="https://pikwizard.com/photo/visualizing-global-financial-data-with-neon-magenta-ribbons-and-candlestick-charts/2e0b06e12bd2c26901951e5d46643652/"
style="text-decoration: none; font-size: 10px; margin: 0;"
>
<img src="https://pikwizard.com/pw/medium/2e0b06e12bd2c26901951e5d46643652.jpg" style="margin: 0; width: 100%;" alt="" />
<p style="font-size: 12px; margin: 0;">PikWizard</p>
</a>
</span>
</span>
Free (free of charge)
Free for personal and commercial use.
Author: Awesome Content
Similar Free Stock Images

Premium


Premium


Premium


Premium


Premium


Premium


Premium


Premium


Premium


Premium


Premium


Premium


Premium


Premium


Premium


Premium


Premium


Premium
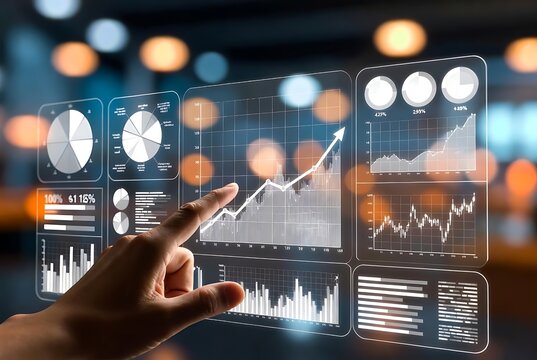
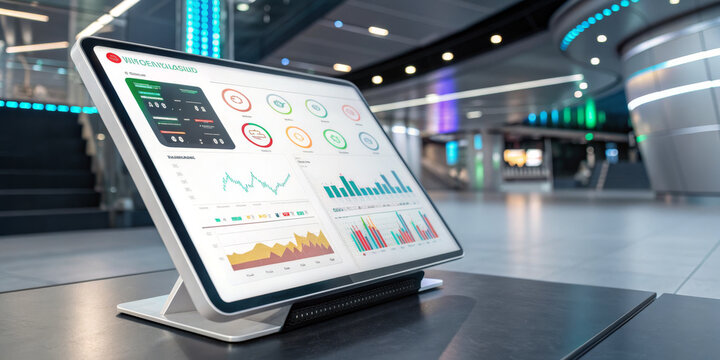
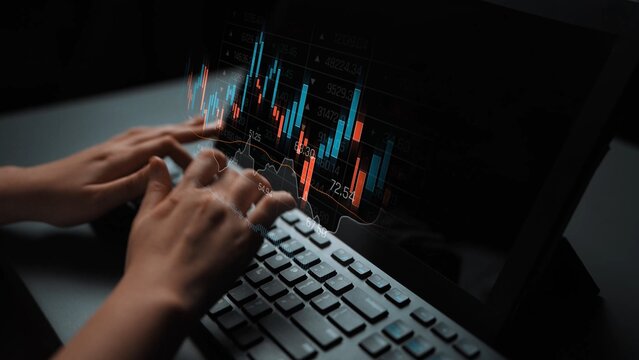
![[The tablet displaying colorful financial candlestick charts and market data in soft bokeh]](https://t4.ftcdn.net/jpg/16/69/72/09/360_F_1669720911_0WX7fuSNVdvc3W4FHVnAjOhcruAw0KWz.jpg)


Premium


Premium


Premium


Premium


Premium


Premium