
- Home >
- Stock Photos >
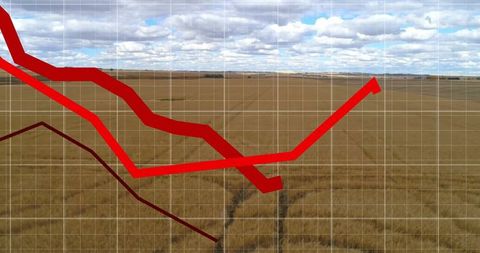
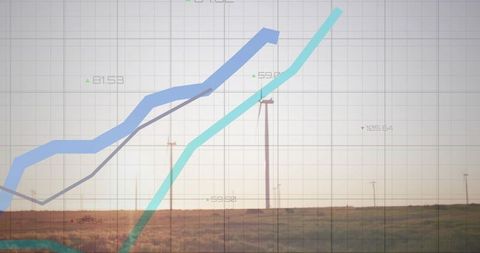
- Visualizing Innovative Data Analytics with Digital Wave Imagery
Visualizing Innovative Data Analytics with Digital Wave Imagery Image

Digitally processed scene mixing technology and analytics conveys advanced business strategies with a robust use of statistics. Use it for presentations emphasizing integration of data and tech, innovative approaches in business contexts, or engaging visual aids for training sessions showcasing importance of analytics in making informed decisions.
Powered by 


downloads
Tags:
More
Credit Photo
If you would like to credit the Photo, here are some ways you can do so
Text Link
photo Link
<span class="text-link">
<span>
<a target="_blank" href=https://pikwizard.com/photo/visualizing-innovative-data-analytics-with-digital-wave-imagery/a6fdf53224c139eb92975e5ef53a0a8c/>PikWizard</a>
</span>
</span>
<span class="image-link">
<span
style="margin: 0 0 20px 0; display: inline-block; vertical-align: middle; width: 100%;"
>
<a
target="_blank"
href="https://pikwizard.com/photo/visualizing-innovative-data-analytics-with-digital-wave-imagery/a6fdf53224c139eb92975e5ef53a0a8c/"
style="text-decoration: none; font-size: 10px; margin: 0;"
>
<img src="https://pikwizard.com/pw/medium/a6fdf53224c139eb92975e5ef53a0a8c.jpg" style="margin: 0; width: 100%;" alt="" />
<p style="font-size: 12px; margin: 0;">PikWizard</p>
</a>
</span>
</span>
Free (free of charge)
Free for personal and commercial use.
Author: Authentic Images
Similar Free Stock Images

Premium


Premium

Premium


Premium


Premium

Premium


Premium

Premium


Premium


Premium


Premium


Premium


Premium

Premium


Premium

Premium


Premium


Premium

Premium


Premium


Premium


Premium


Premium


Premium


Premium


Explore More Free Stock Images