
- Home >
- Free Stock Photos & Images >
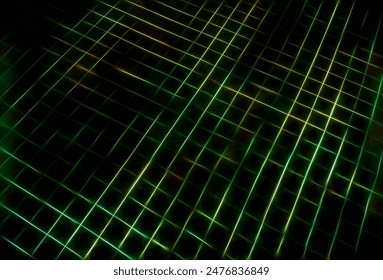
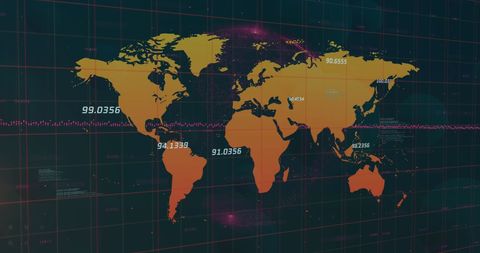
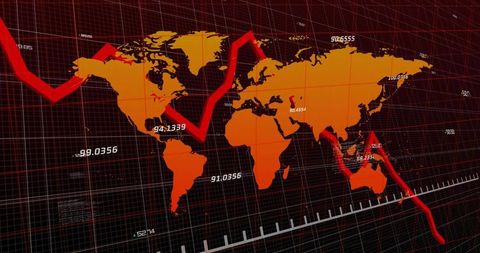
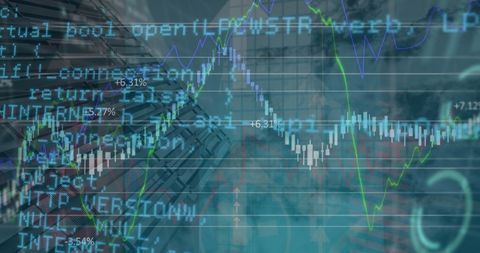
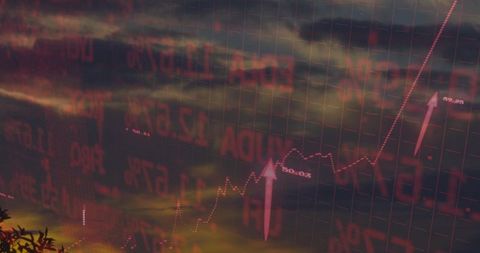
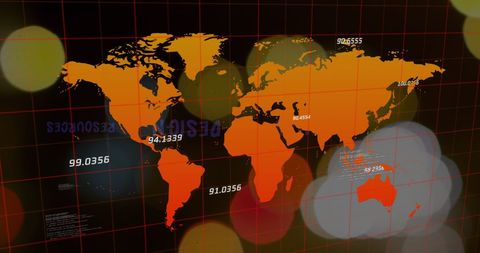
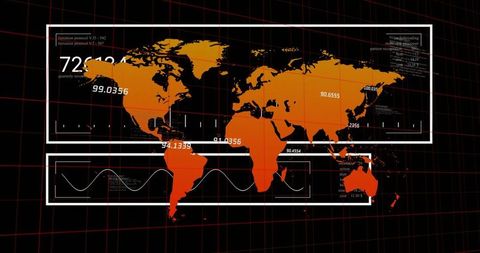
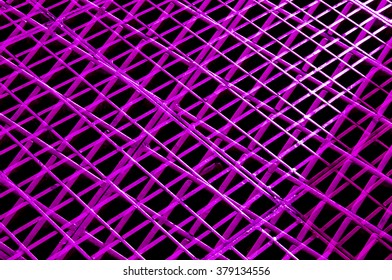
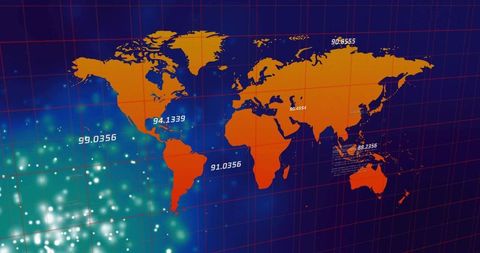
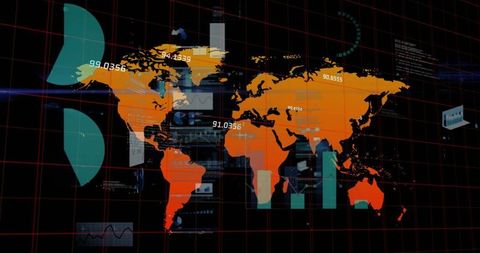
- Visualizing Neon Grid and Heatmap with Floating Code for Futuristic Data Analytics Panel
Visualizing Neon Grid and Heatmap with Floating Code for Futuristic Data Analytics Panel Free Stock Image

Neon-green grid overlaying dark field while orange heatmap clusters glowing through layered planes, with floating programming code strings creating holographic, futuristic depth. High-contrast color palette delivering energetic, urgent mood. Composition offering strong diagonal flow and open space for headline or logo placement. Usage ideas: - Use for technology headlines, AI and machine learning articles, data analytics and big data reports - Use for cybersecurity, software development, debugging and devops marketing materials - Use for presentation slides, website hero banners, social media headers, blog post covers - Use for book covers, posters, product landing pages, UI mockups and pitch decks - Crop left or right to position headline; use full-bleed to create immersive background; apply selective blur or color overlay to increase text readability Color palette notes: neon green, fiery orange, deep black creating high contrast look. Visual style suitable for futuristic, cyberpunk or tech-focused creative projects.
Powered by  - Get 15% off with code: PIKWIZARD15


downloads
Tags:
More
Credit Photo
If you would like to credit the Photo, here are some ways you can do so
Text Link
photo Link
<span class="text-link">
<span>
<a target="_blank" href=https://pikwizard.com/photo/visualizing-neon-grid-and-heatmap-with-floating-code-for-futuristic-data-analytics-panel/9d8da8adf4df50fd2c8f9658c35cc585/>PikWizard</a>
</span>
</span>
<span class="image-link">
<span
style="margin: 0 0 20px 0; display: inline-block; vertical-align: middle; width: 100%;"
>
<a
target="_blank"
href="https://pikwizard.com/photo/visualizing-neon-grid-and-heatmap-with-floating-code-for-futuristic-data-analytics-panel/9d8da8adf4df50fd2c8f9658c35cc585/"
style="text-decoration: none; font-size: 10px; margin: 0;"
>
<img src="https://thumbs.wbm.im/pw/medium/9d8da8adf4df50fd2c8f9658c35cc585.jpg" style="margin: 0; width: 100%;" alt="Visualizing Neon Grid and Heatmap with Floating Code for Futuristic Data Analytics Panel" />
<p style="font-size: 12px; margin: 0;">PikWizard</p>
</a>
</span>
</span>
Free (free of charge)
Free for personal and commercial use.
Author: Awesome Content
Similar Free Stock Images


Premium


Premium


Premium


Premium


Premium


Premium


Premium


Premium


Premium


Premium


Premium


Premium


Premium


Premium


Premium


Premium


Premium


Premium


Premium


Premium


Premium


Premium


Premium


Premium


Premium

Explore More Free Stock Images