
- Home >
- Stock Photos >
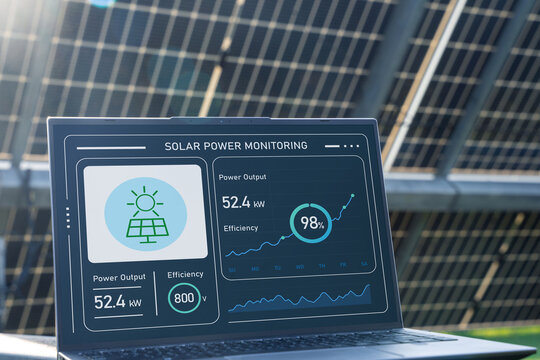
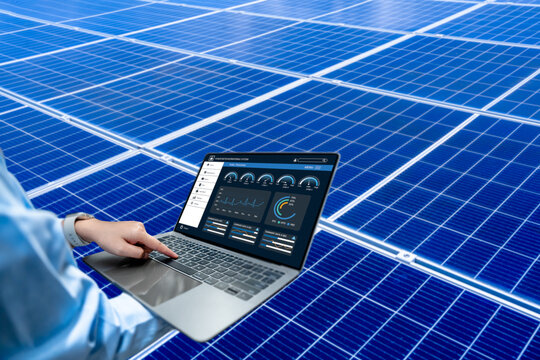
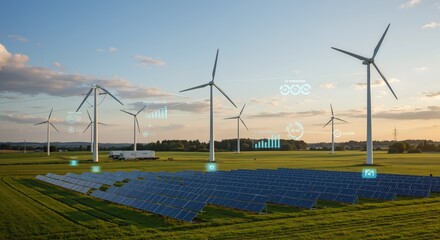
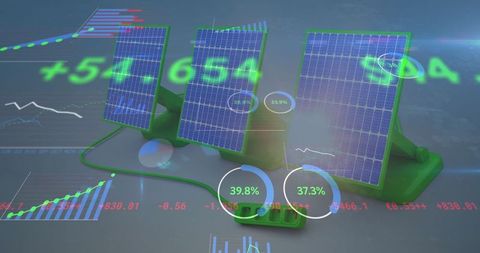
- Visualizing Solar Power Data Analytics in Renewable Energy
Visualizing Solar Power Data Analytics in Renewable Energy Image

Conceptual digital overlay of solar panels and dynamic data charts represents synergy of technology and renewable energy. Useful for illustrating the role of analytics in optimizing solar energy solutions. Ideal for blogs, presentations on sustainable energy highlights data-driven decision making in clean energy technologies.
Powered by 


downloads
Tags:
More
Credit Photo
If you would like to credit the Photo, here are some ways you can do so
Text Link
photo Link
<span class="text-link">
<span>
<a target="_blank" href=https://pikwizard.com/photo/visualizing-solar-power-data-analytics-in-renewable-energy/054bbbb86f6c1942365ffee80e6b134d/>PikWizard</a>
</span>
</span>
<span class="image-link">
<span
style="margin: 0 0 20px 0; display: inline-block; vertical-align: middle; width: 100%;"
>
<a
target="_blank"
href="https://pikwizard.com/photo/visualizing-solar-power-data-analytics-in-renewable-energy/054bbbb86f6c1942365ffee80e6b134d/"
style="text-decoration: none; font-size: 10px; margin: 0;"
>
<img src="https://pikwizard.com/pw/medium/054bbbb86f6c1942365ffee80e6b134d.jpg" style="margin: 0; width: 100%;" alt="" />
<p style="font-size: 12px; margin: 0;">PikWizard</p>
</a>
</span>
</span>
Free (free of charge)
Free for personal and commercial use.
Author: People Creations
Similar Free Stock Images

Premium


Premium


Premium


Premium

Premium


Premium


Premium


Premium


Premium


Premium
Premium


Premium


Premium


Premium


Premium


Premium


Premium


Premium


AI


Premium


Premium


Premium

Premium


Premium


AI


Premium

Premium


Explore More Free Stock Images