
- Home >
- Stock Photos >
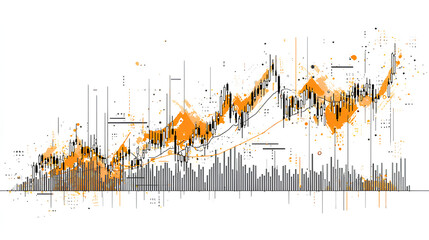
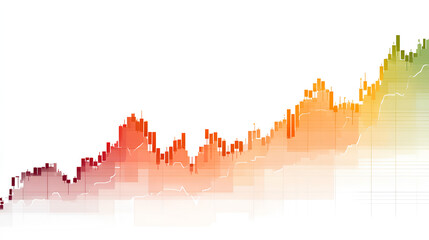
- Visualizing Stock Market and Data Analytics Trends
Visualizing Stock Market and Data Analytics Trends Image

Illustrating convergence of stock market data with analytics tools, emphasizing interconnectedness of global business operations. Useful for illustrating concepts in business analysis, financial education, data-driven discussions, and digital publications focused on emerging business technologies.
Powered by 


downloads
Tags:
More
Credit Photo
If you would like to credit the Photo, here are some ways you can do so
Text Link
photo Link
<span class="text-link">
<span>
<a target="_blank" href=https://pikwizard.com/photo/visualizing-stock-market-and-data-analytics-trends/0f0b44288d30338d153e2c262bb32b81/>PikWizard</a>
</span>
</span>
<span class="image-link">
<span
style="margin: 0 0 20px 0; display: inline-block; vertical-align: middle; width: 100%;"
>
<a
target="_blank"
href="https://pikwizard.com/photo/visualizing-stock-market-and-data-analytics-trends/0f0b44288d30338d153e2c262bb32b81/"
style="text-decoration: none; font-size: 10px; margin: 0;"
>
<img src="https://pikwizard.com/pw/medium/0f0b44288d30338d153e2c262bb32b81.jpg" style="margin: 0; width: 100%;" alt="" />
<p style="font-size: 12px; margin: 0;">PikWizard</p>
</a>
</span>
</span>
Free (free of charge)
Free for personal and commercial use.
Author: People Creations
Similar Free Stock Images

Premium

Premium


Premium


Premium


Premium


Premium


Premium


Premium

Premium


Premium


Premium

Premium


Premium


Premium


Premium


Premium


Premium


Premium


Premium


Premium


Premium


Premium

Premium


Premium


Premium

Explore More Free Stock Images