
- Home >
- Stock Photos >
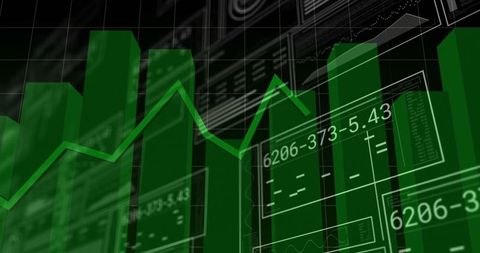
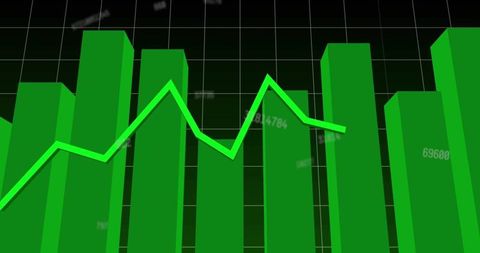
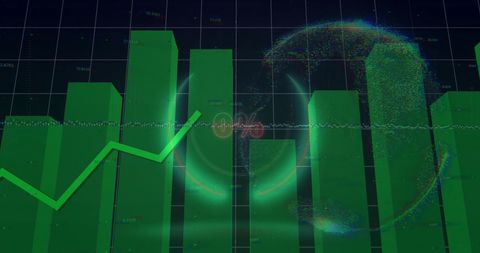
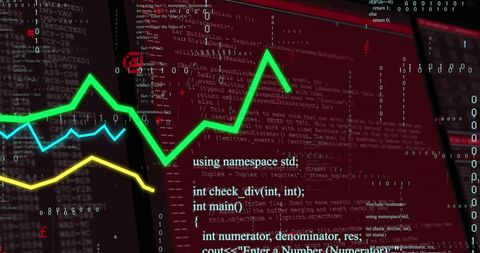
- Visualizing Trends in Financial Data with Code and Graphs
Visualizing Trends in Financial Data with Code and Graphs Image

Digital representation of financial data merging with coding elements. Highlights intersections of finance and technology. Useful for illustrating concepts in financial analytics, programming in finance, and data interpretation trends in technology-related articles, presentations, or educational materials.
Powered by 


downloads
Tags:
More
Credit Photo
If you would like to credit the Photo, here are some ways you can do so
Text Link
photo Link
<span class="text-link">
<span>
<a target="_blank" href=https://pikwizard.com/photo/visualizing-trends-in-financial-data-with-code-and-graphs/9992825ce359f3ce284a0347682c7498/>PikWizard</a>
</span>
</span>
<span class="image-link">
<span
style="margin: 0 0 20px 0; display: inline-block; vertical-align: middle; width: 100%;"
>
<a
target="_blank"
href="https://pikwizard.com/photo/visualizing-trends-in-financial-data-with-code-and-graphs/9992825ce359f3ce284a0347682c7498/"
style="text-decoration: none; font-size: 10px; margin: 0;"
>
<img src="https://pikwizard.com/pw/medium/9992825ce359f3ce284a0347682c7498.jpg" style="margin: 0; width: 100%;" alt="" />
<p style="font-size: 12px; margin: 0;">PikWizard</p>
</a>
</span>
</span>
Free (free of charge)
Free for personal and commercial use.
Author: Creative Art
Similar Free Stock Images

Premium


Premium

Premium


Premium


Premium


Premium


Premium

Premium

Premium

Premium


Premium


Premium


Premium


Premium


Premium


Premium


Premium

Premium


Premium


Premium


Premium


Premium


Premium


Premium


Premium

Explore More Free Stock Images