- Home >
- Stock Photos >
- Vivid Fractal Visualization with Candlestick and Moving Average Analysis
Vivid Fractal Visualization with Candlestick and Moving Average Analysis Image
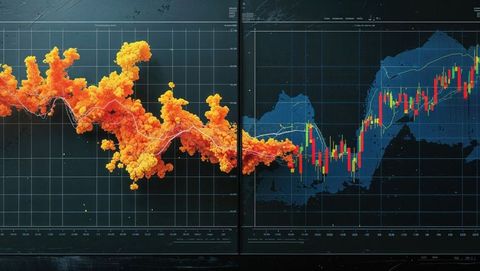
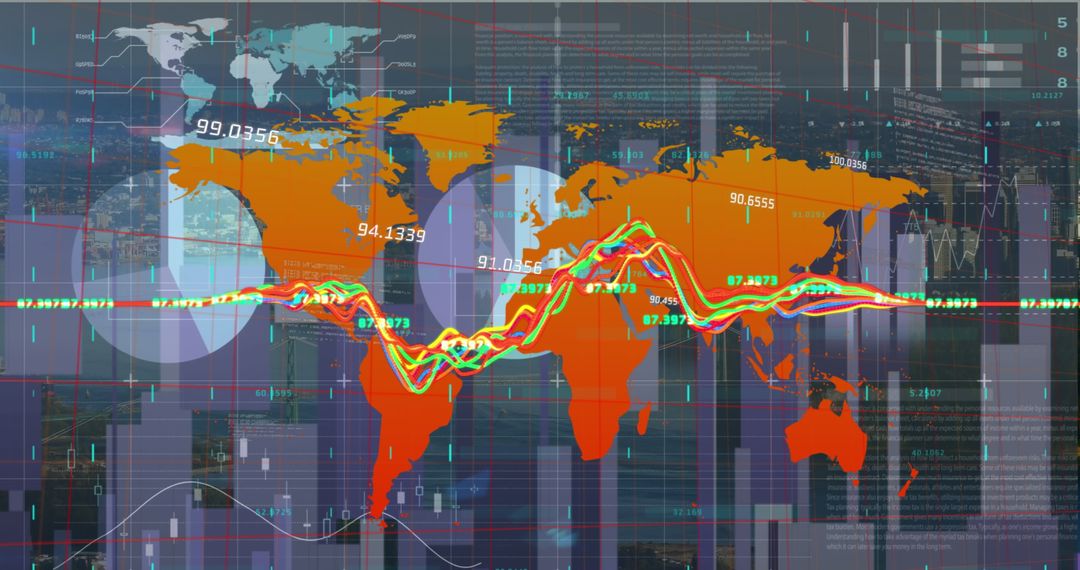
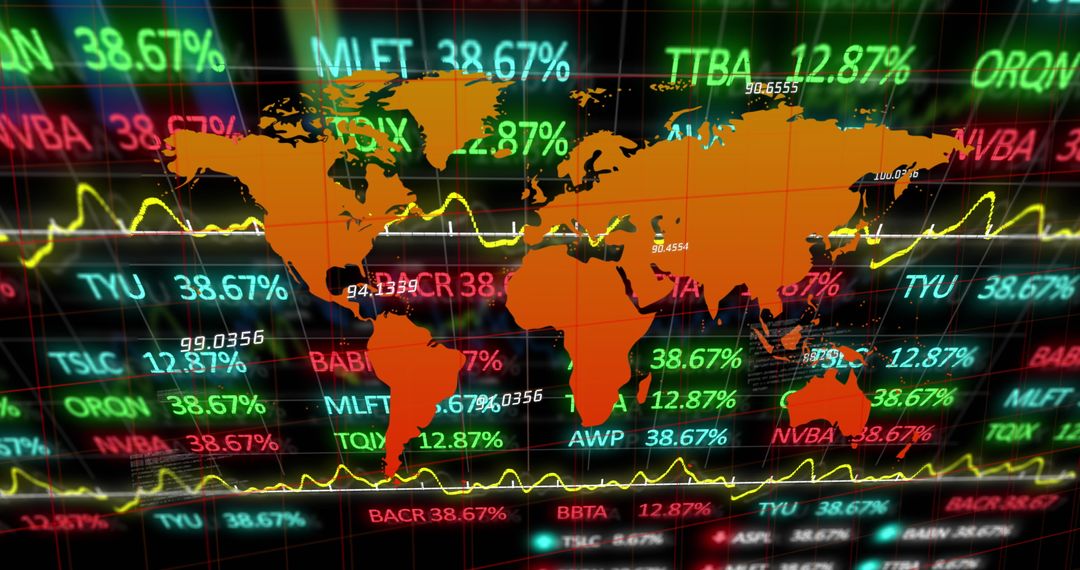
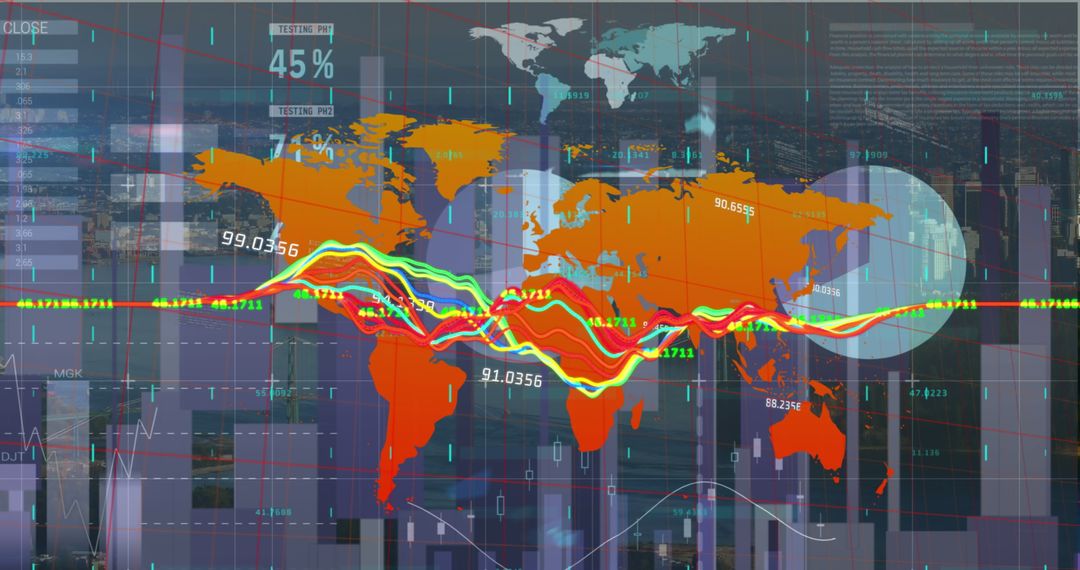
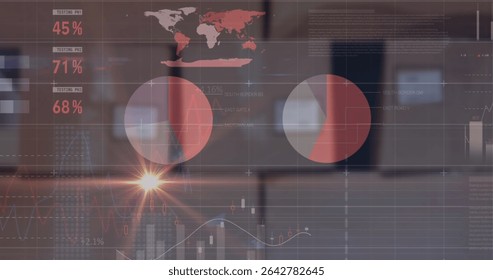
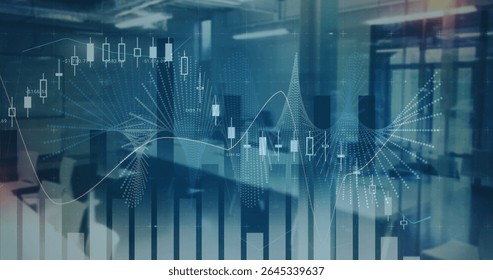
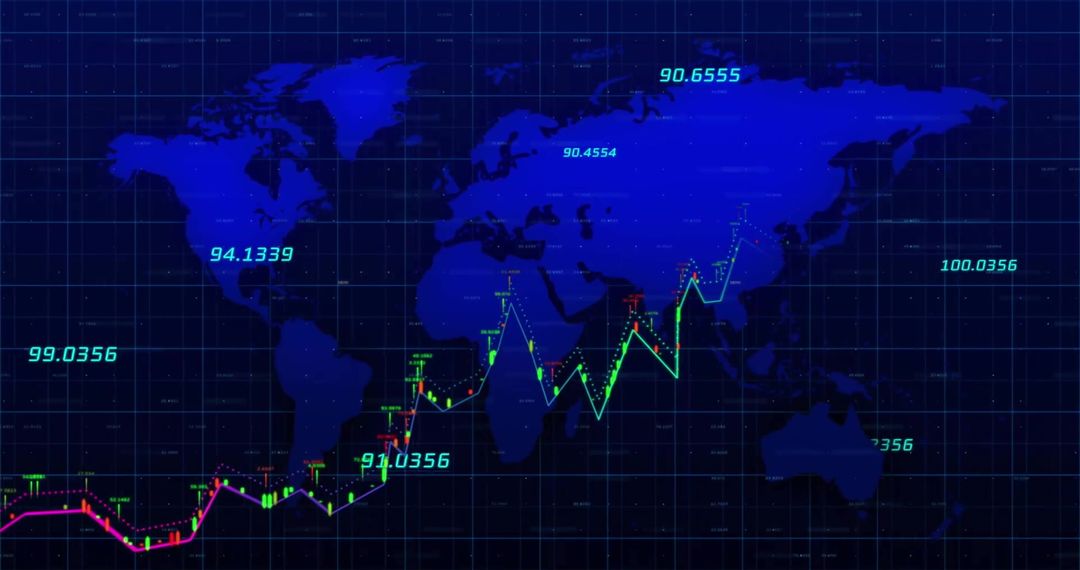
AI Generated Image. The image exhibits a captivating contrast between vivid orange fractal formations and classical financial charts such as candlestick patterns and moving averages, depicted across dual monitors. This technologically advanced depiction emphasizes data-driven decision-making in finance and investment sectors. It can be effectively used for portraying concepts within financial market analysis, machine learning implementation in stock markets, and enhancing technological insights within the finance industry.
Powered by  - Get 15% off with code: PIKWIZARD15


2
downloads
downloads
Tags:
More
Credit Photo
If you would like to credit the Photo, here are some ways you can do so
Text Link
photo Link
<span class="text-link">
<span>
<a target="_blank" href=https://pikwizard.com/photo/vivid-fractal-visualization-with-candlestick-and-moving-average-analysis/6c73eaa4dc255926159fe99f666154b3/>PikWizard</a>
</span>
</span>
<span class="image-link">
<span
style="margin: 0 0 20px 0; display: inline-block; vertical-align: middle; width: 100%;"
>
<a
target="_blank"
href="https://pikwizard.com/photo/vivid-fractal-visualization-with-candlestick-and-moving-average-analysis/6c73eaa4dc255926159fe99f666154b3/"
style="text-decoration: none; font-size: 10px; margin: 0;"
>
<img src="https://pikwizard.com/pw/medium/6c73eaa4dc255926159fe99f666154b3.jpg" style="margin: 0; width: 100%;" alt="" />
<p style="font-size: 12px; margin: 0;">PikWizard</p>
</a>
</span>
</span>
Free (free of charge)
Free for personal and commercial use.
Author: AI Creator
Similar Free Stock Images

Premium


Premium


Premium


Premium


Premium


Premium


Premium


Premium


Premium


Premium


Premium


Premium


Premium


Premium


Premium


Premium


Premium


Premium


Premium


Premium


Premium


Premium


Premium


Premium