
- Home >
- Stock Photos >
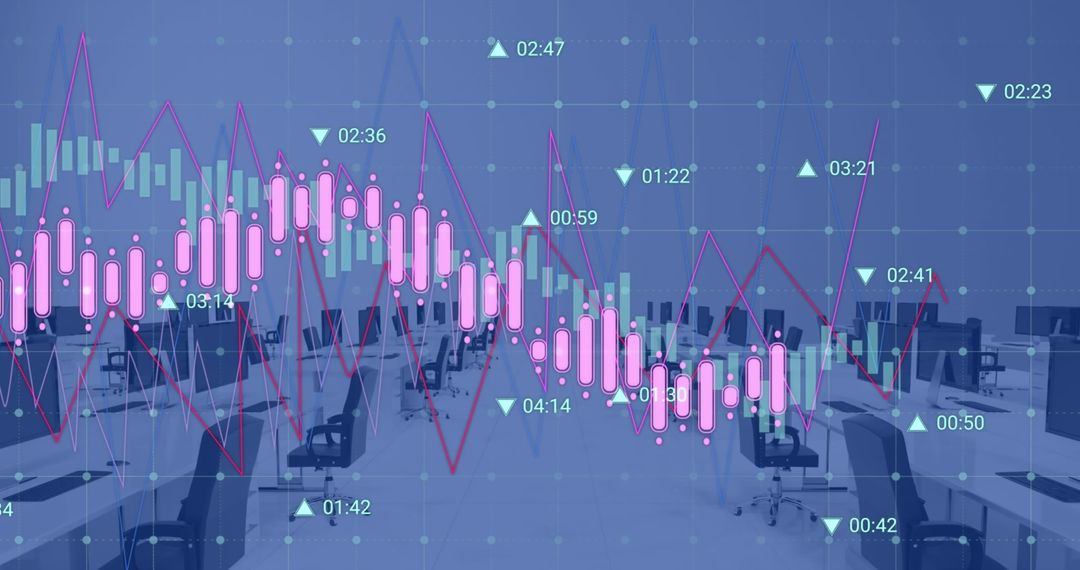
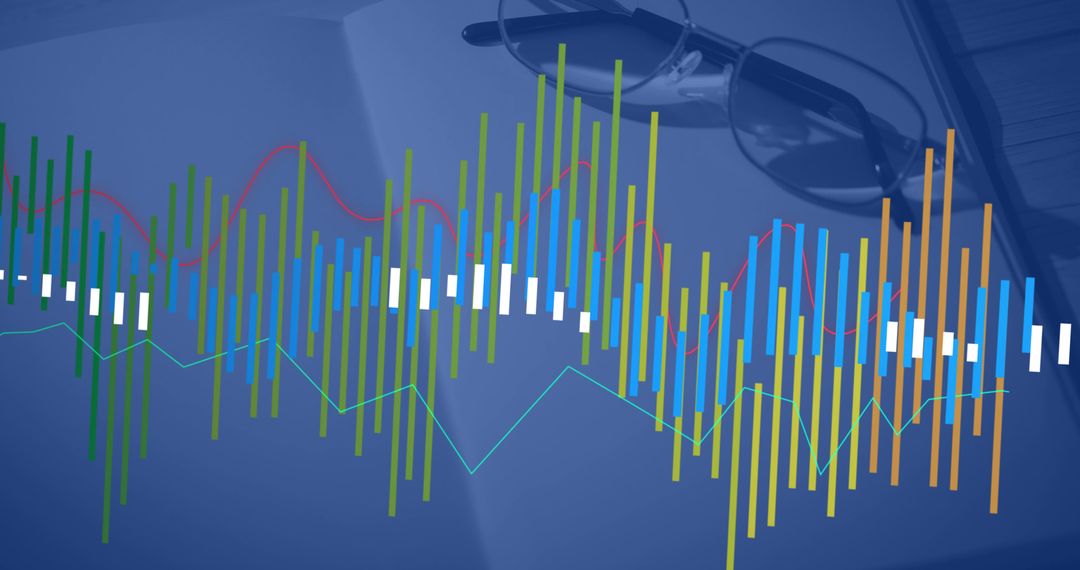
- Walking Colleagues in Glass Atrium with Neon Magenta Bar Chart and Cyan Data Grid Overlay
Walking Colleagues in Glass Atrium with Neon Magenta Bar Chart and Cyan Data Grid Overlay Image

Depicting two colleagues walking through sunlit glass atrium with neon magenta bar chart and cyan grid overlay creating modern data-centric atmosphere. Vibrant color contrast and transparent layers emphasizing analytics, trend tracking, and digital transformation themes. Supporting business presentations, analytics reports, financial newsletters, startup pitch decks, website hero banners, marketing campaigns, and editorial pieces about workplace technology. Offering crop-friendly composition for hero banners and slide backgrounds, leaving space for headline text and icons on left. Suitable for conveying innovation, teamwork, performance metrics, and data-driven decision making.
Powered by  - Get 15% off with code: PIKWIZARD15


0
downloads
downloads
Tags:
More
Credit Photo
If you would like to credit the Photo, here are some ways you can do so
Text Link
photo Link
<span class="text-link">
<span>
<a target="_blank" href=https://pikwizard.com/photo/walking-colleagues-in-glass-atrium-with-neon-magenta-bar-chart-and-cyan-data-grid-overlay/dd192fe3383c49b4a5a246e53c5174f7/>PikWizard</a>
</span>
</span>
<span class="image-link">
<span
style="margin: 0 0 20px 0; display: inline-block; vertical-align: middle; width: 100%;"
>
<a
target="_blank"
href="https://pikwizard.com/photo/walking-colleagues-in-glass-atrium-with-neon-magenta-bar-chart-and-cyan-data-grid-overlay/dd192fe3383c49b4a5a246e53c5174f7/"
style="text-decoration: none; font-size: 10px; margin: 0;"
>
<img src="https://pikwizard.com/pw/medium/dd192fe3383c49b4a5a246e53c5174f7.jpg" style="margin: 0; width: 100%;" alt="" />
<p style="font-size: 12px; margin: 0;">PikWizard</p>
</a>
</span>
</span>
Free (free of charge)
Free for personal and commercial use.
Author: Creative Art
Similar Free Stock Images

Premium


Premium


Premium


Premium


Premium


Premium


Premium


Premium


Premium


Premium


Premium


Premium


Premium


Premium


Premium


Premium


Premium


Premium


Premium


Premium


Premium


Premium


Premium


Premium

