- Home >
- Stock Photos >
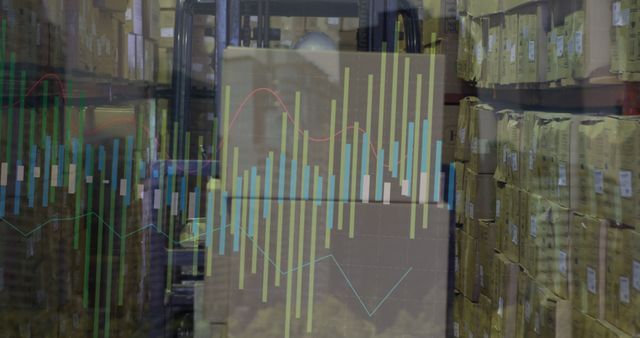
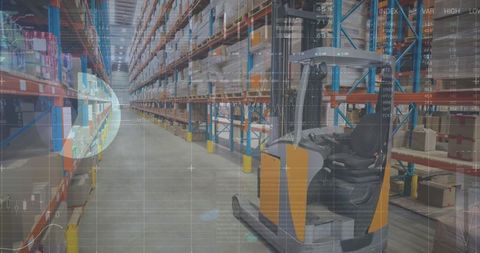
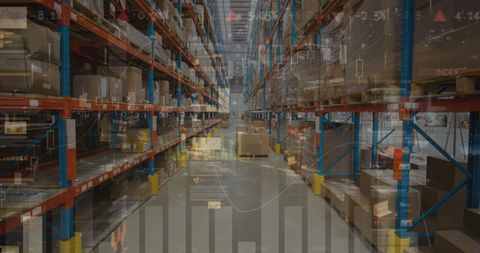
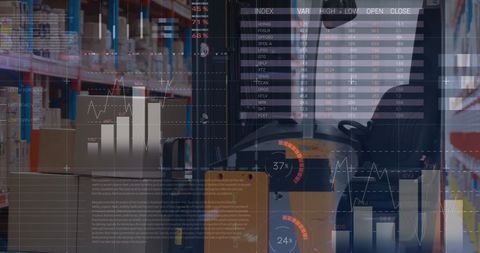
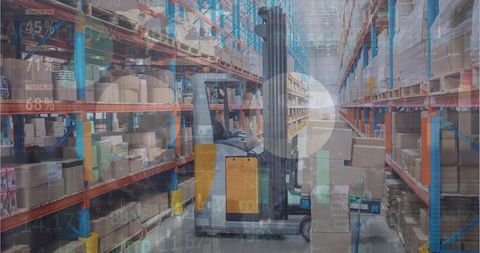
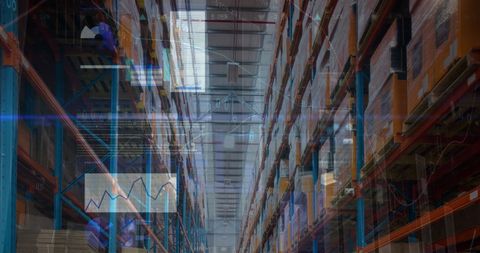
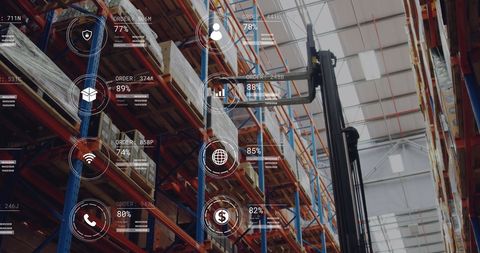
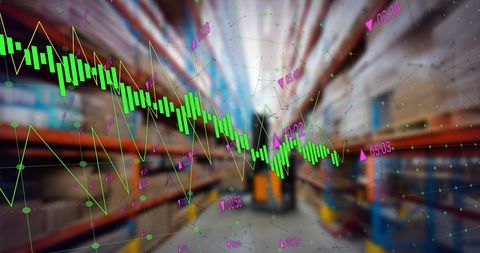
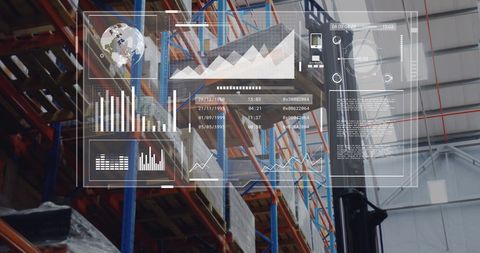
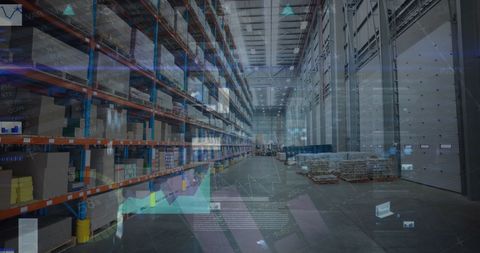
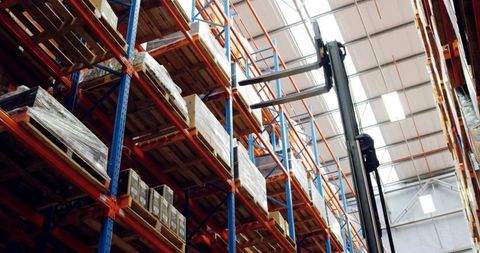
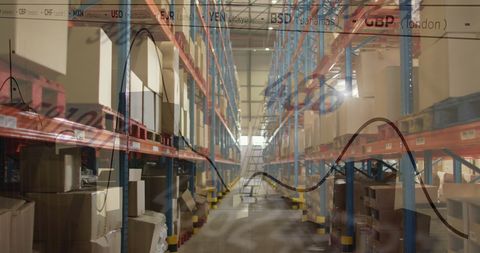
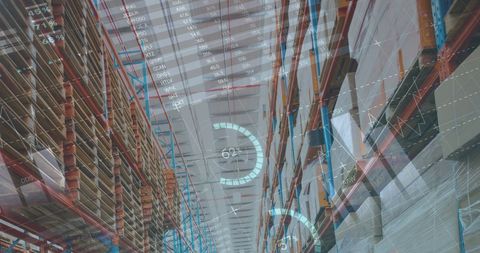
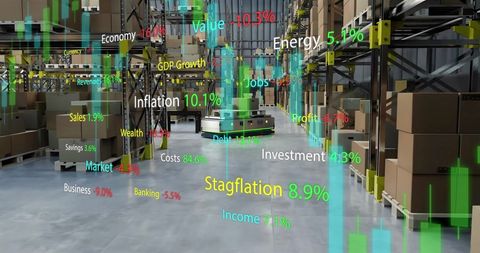
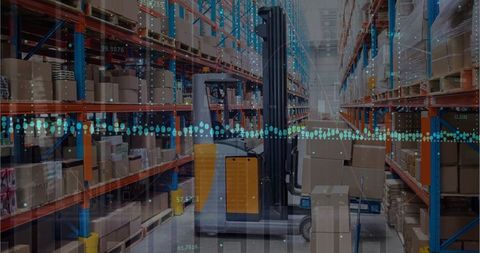
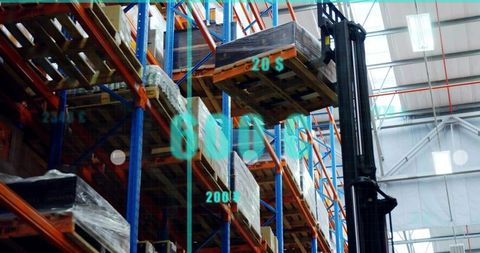
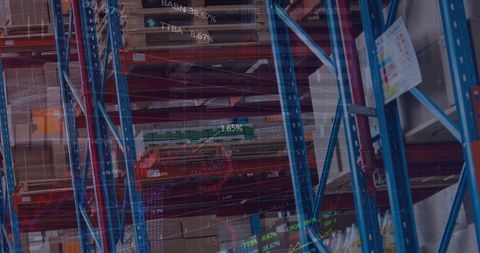
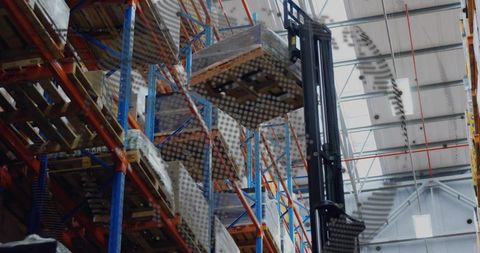
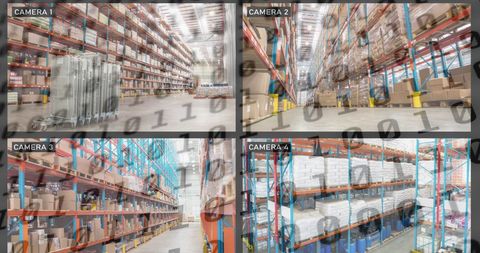
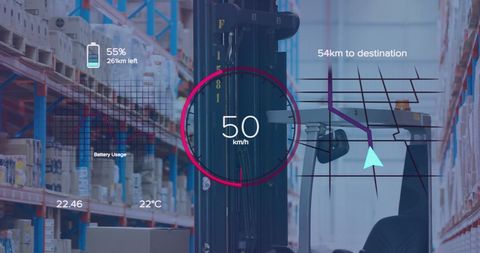
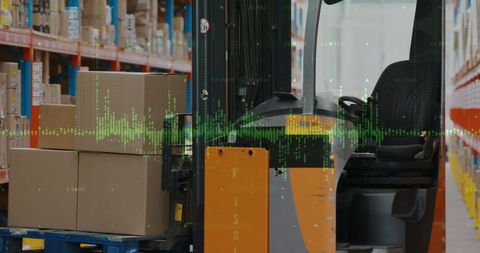
- Warehouse and Analytics Graph Interface Integration
Warehouse and Analytics Graph Interface Integration Image

Shows an integrated view of warehouse operations with superimposed data graphs. Suitable for concepts on logistics optimization, business analytics, technology in supply chains, and the digital transformation of delivery services.

downloads
Tags:
More
Credit Photo
If you would like to credit the Photo, here are some ways you can do so
Text Link
photo Link
<span class="text-link">
<span>
<a target="_blank" href=https://pikwizard.com/photo/warehouse-and-analytics-graph-interface-integration/61670b23f343fde311cc2d5cc235e7d7/>PikWizard</a>
</span>
</span>
<span class="image-link">
<span
style="margin: 0 0 20px 0; display: inline-block; vertical-align: middle; width: 100%;"
>
<a
target="_blank"
href="https://pikwizard.com/photo/warehouse-and-analytics-graph-interface-integration/61670b23f343fde311cc2d5cc235e7d7/"
style="text-decoration: none; font-size: 10px; margin: 0;"
>
<img src="https://pikwizard.com/pw/medium/61670b23f343fde311cc2d5cc235e7d7.jpg" style="margin: 0; width: 100%;" alt="" />
<p style="font-size: 12px; margin: 0;">PikWizard</p>
</a>
</span>
</span>
Free (free of charge)
Free for personal and commercial use.
Author: People Creations