- Home >
- Stock Photos >
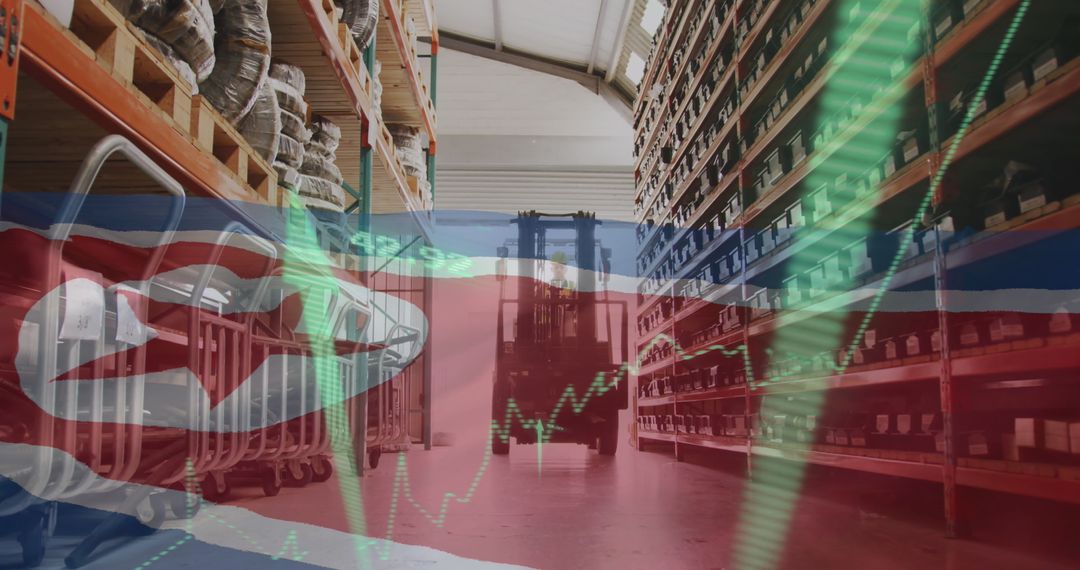
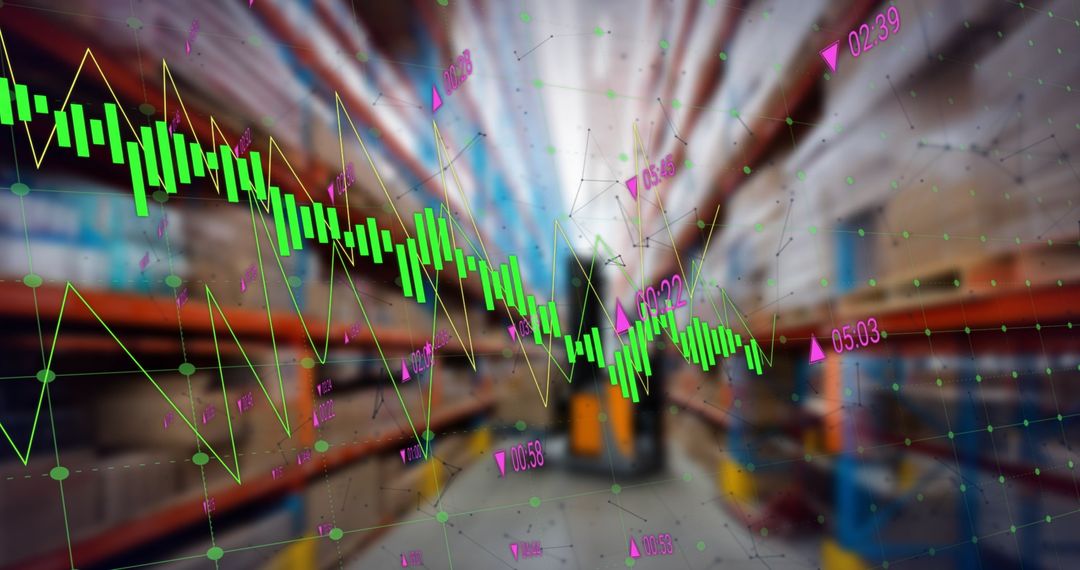
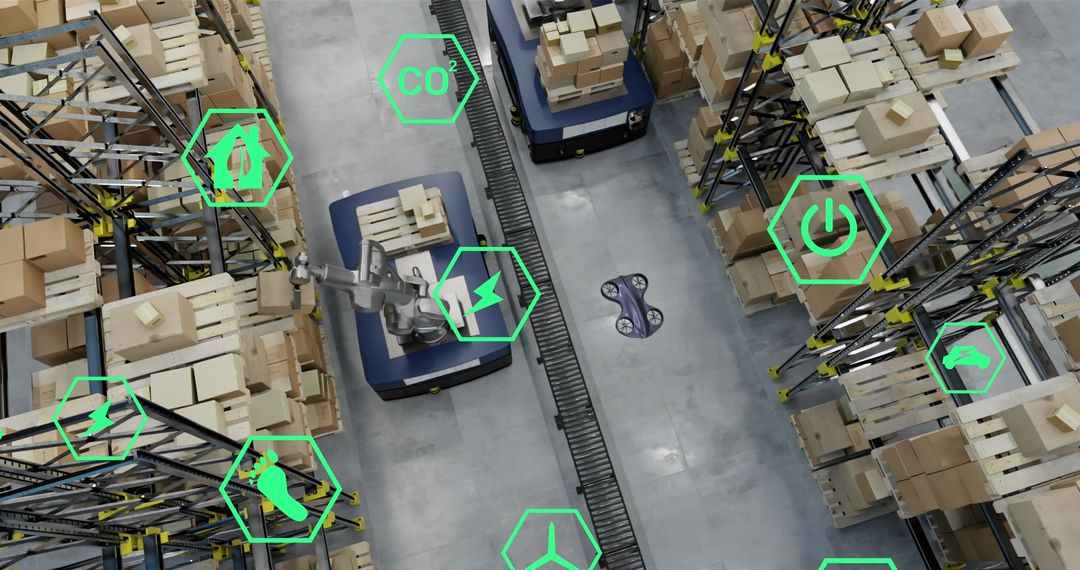
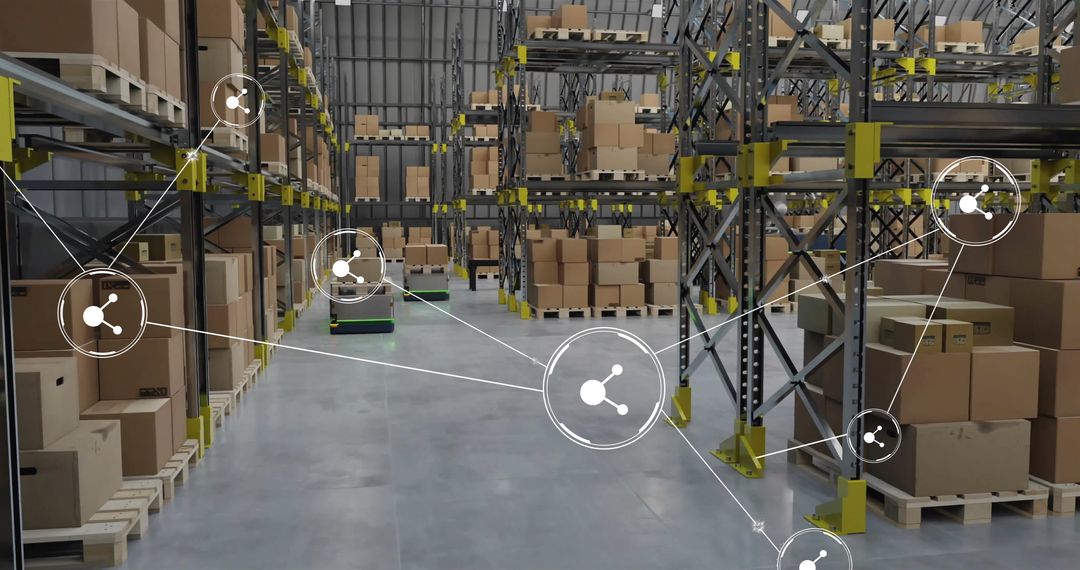
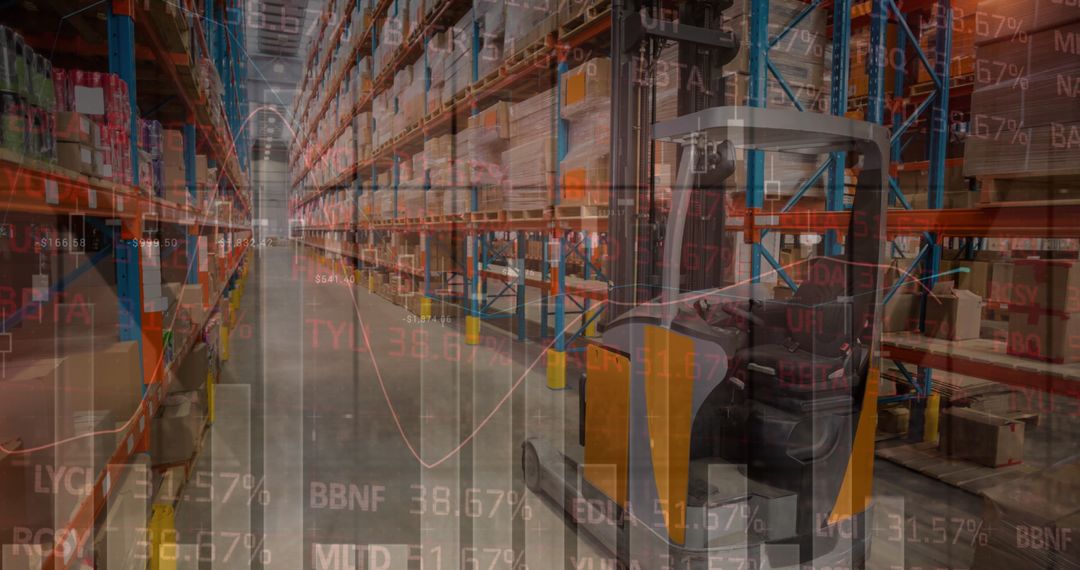
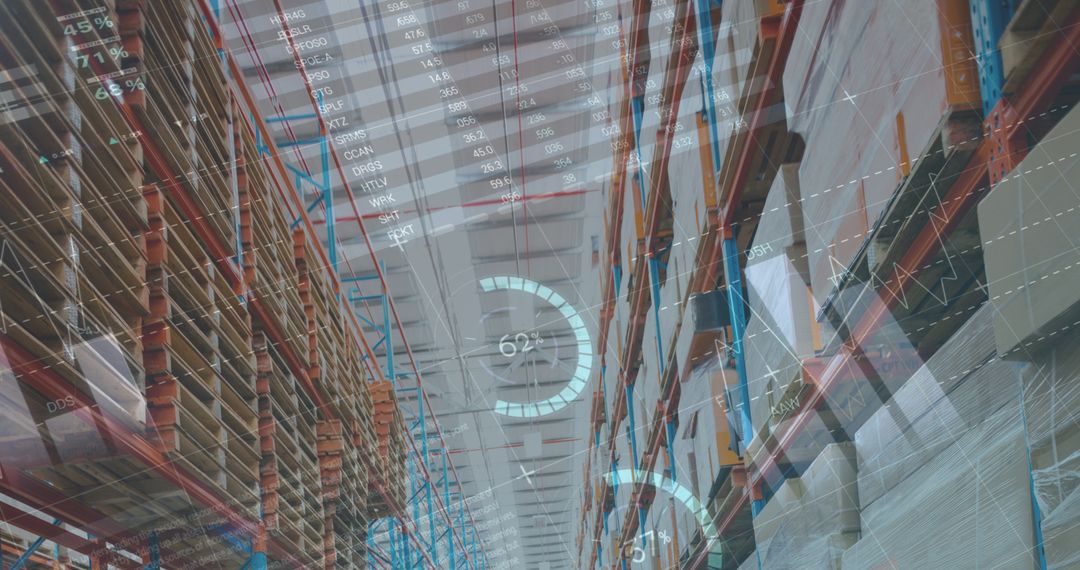
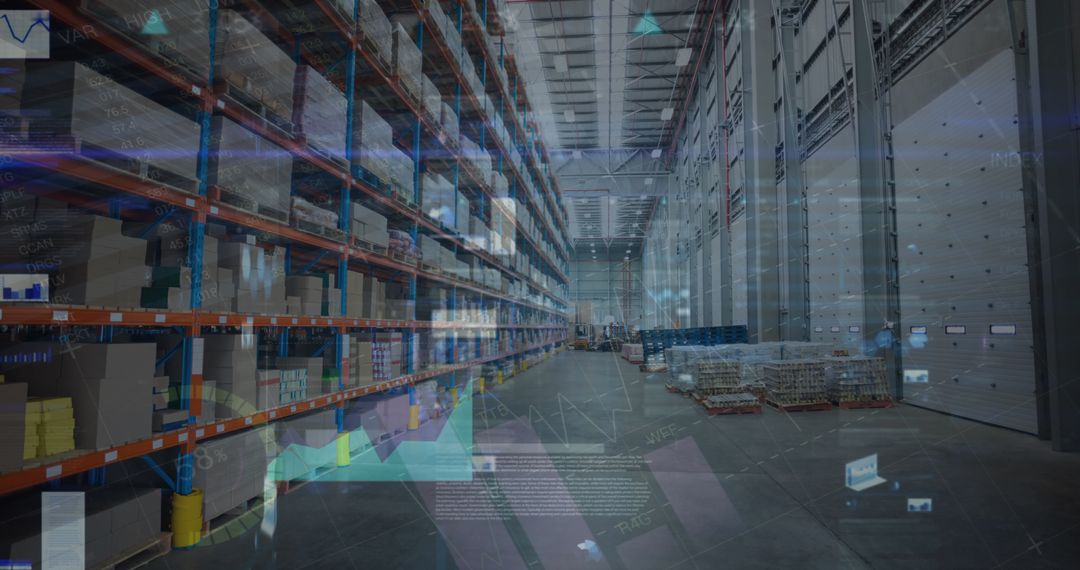
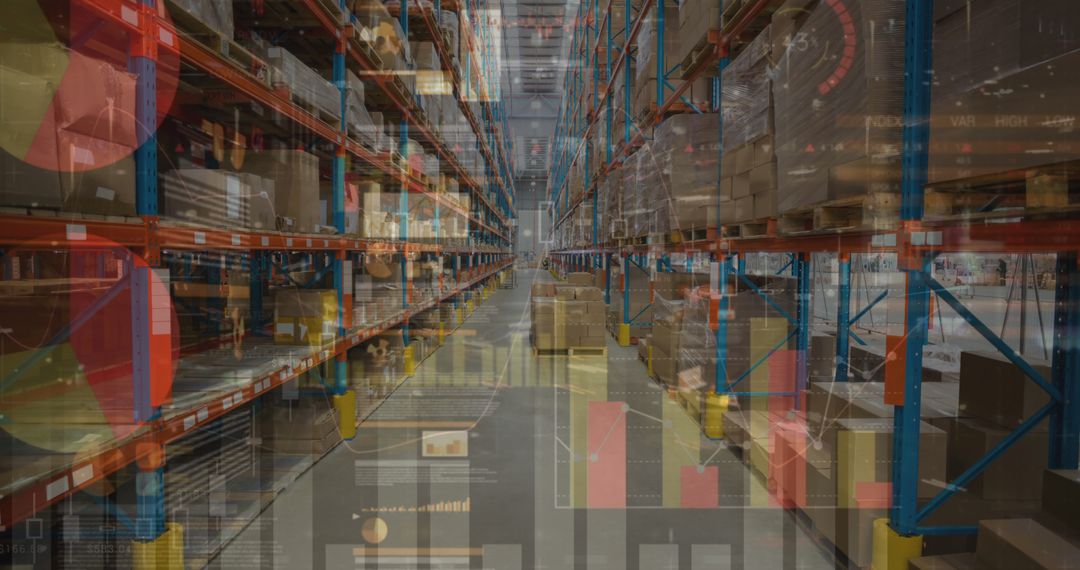
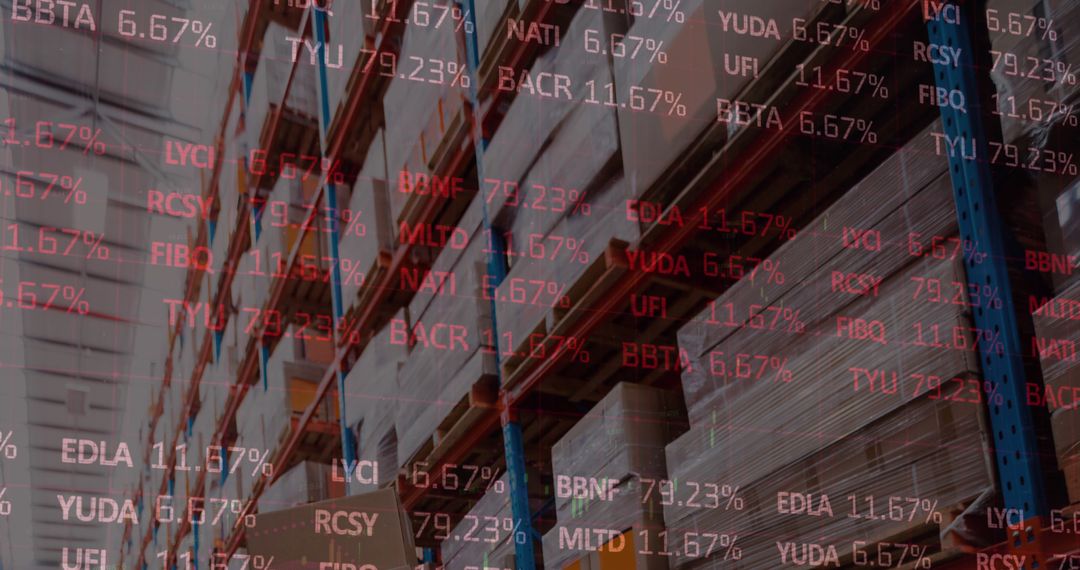
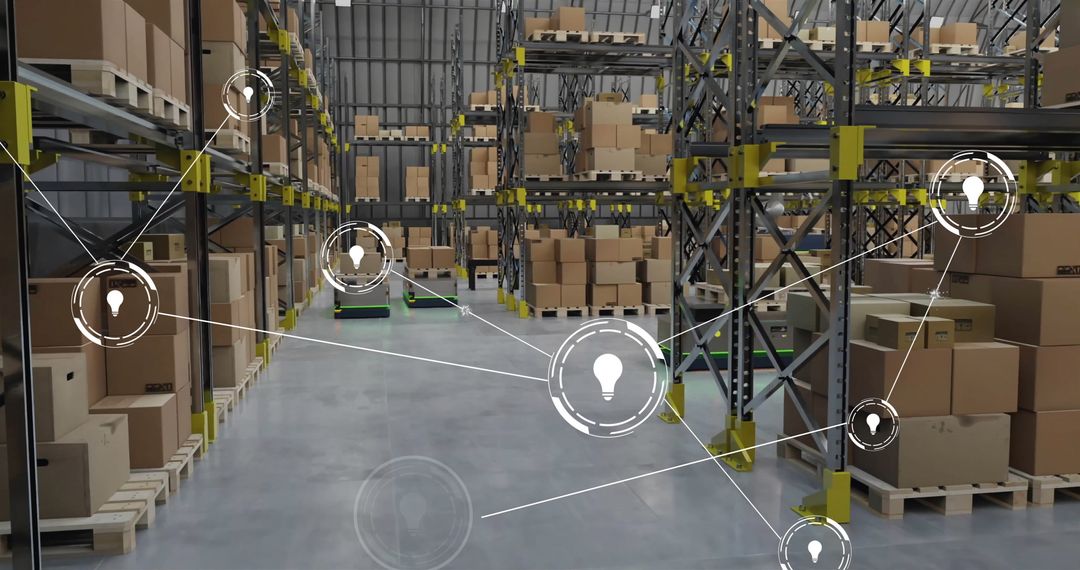
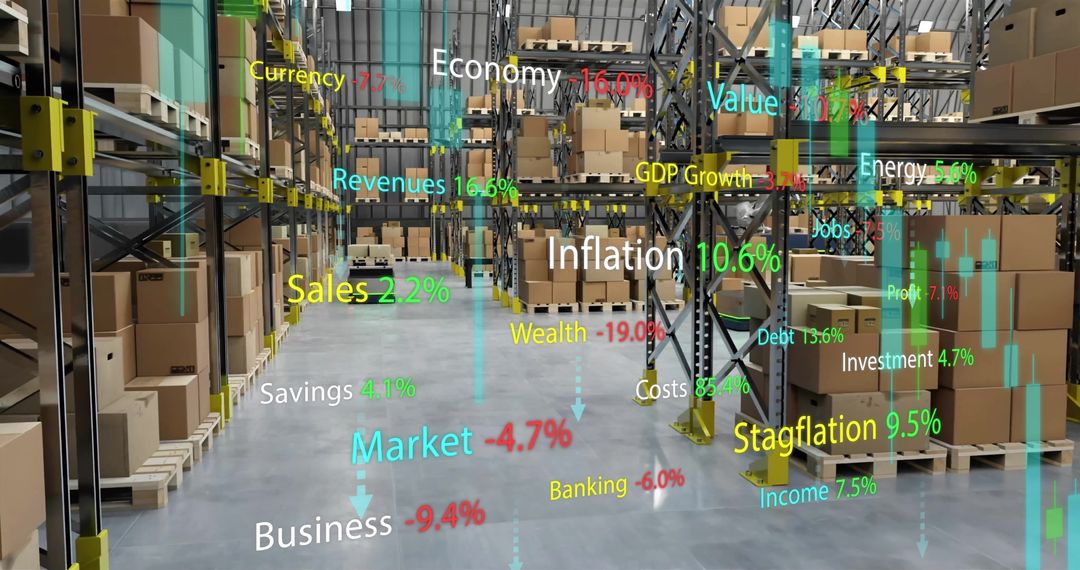
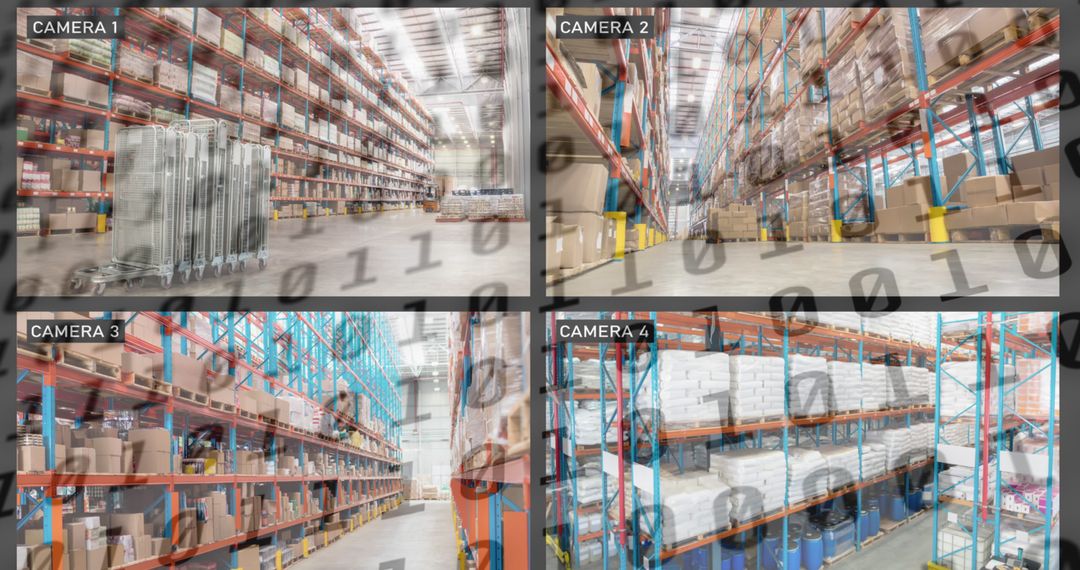
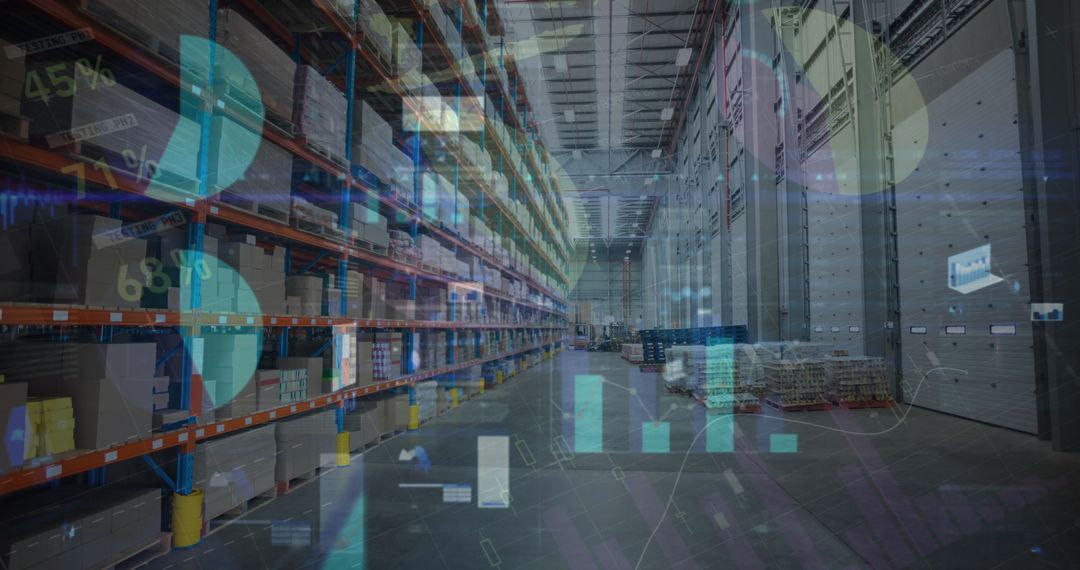
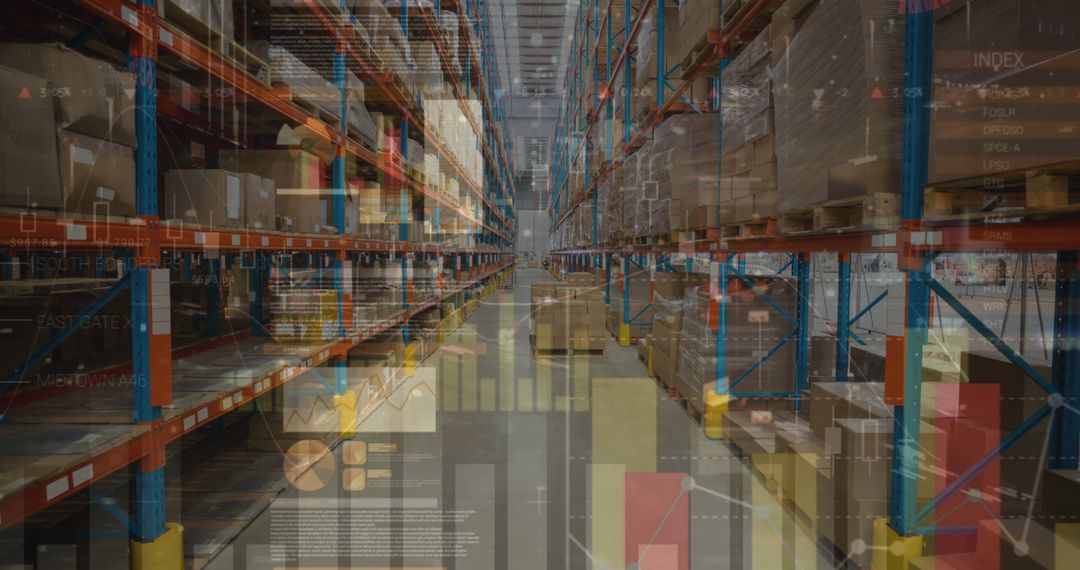
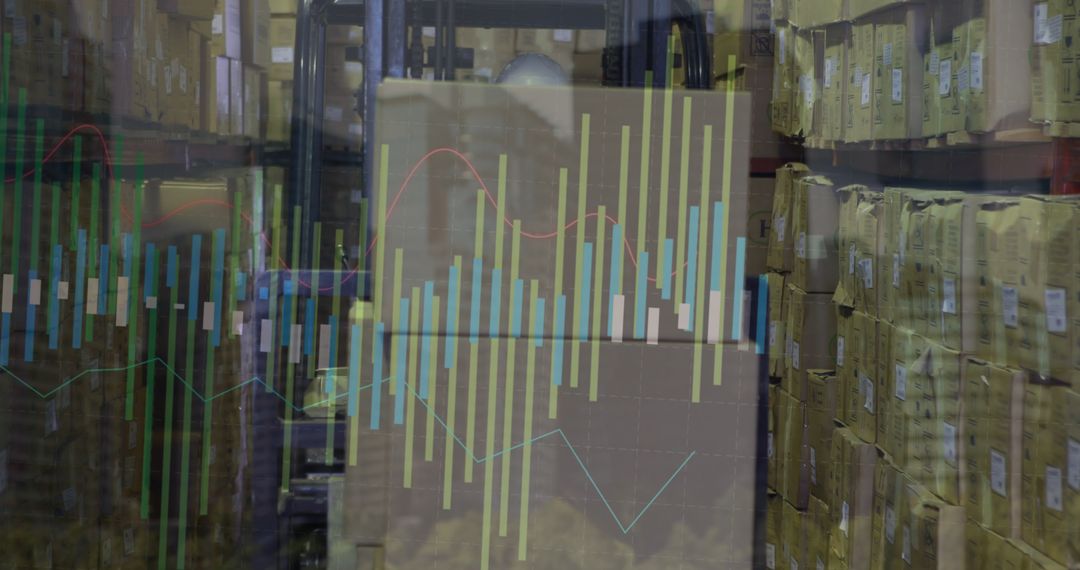
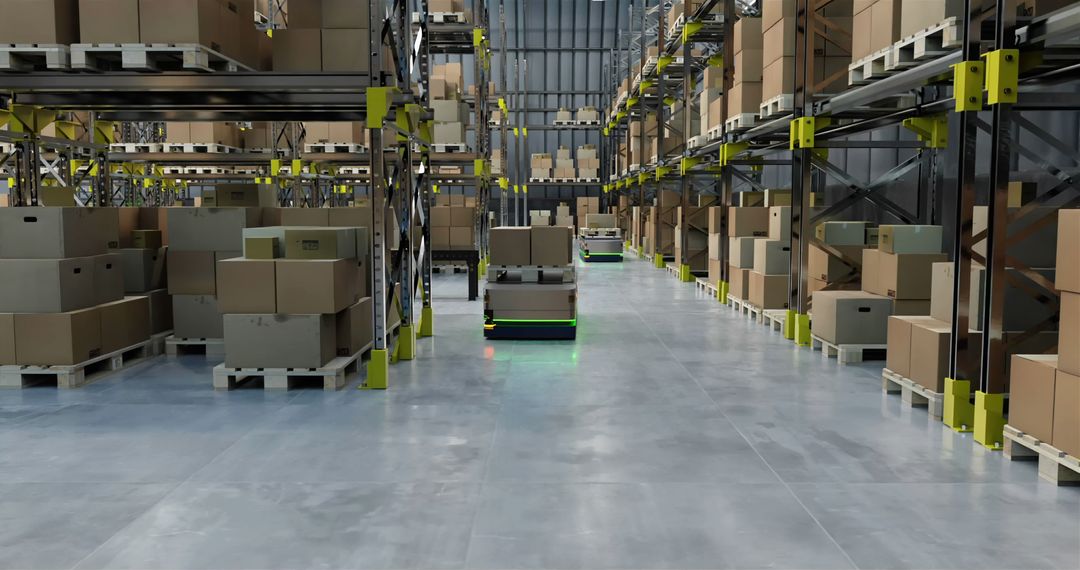
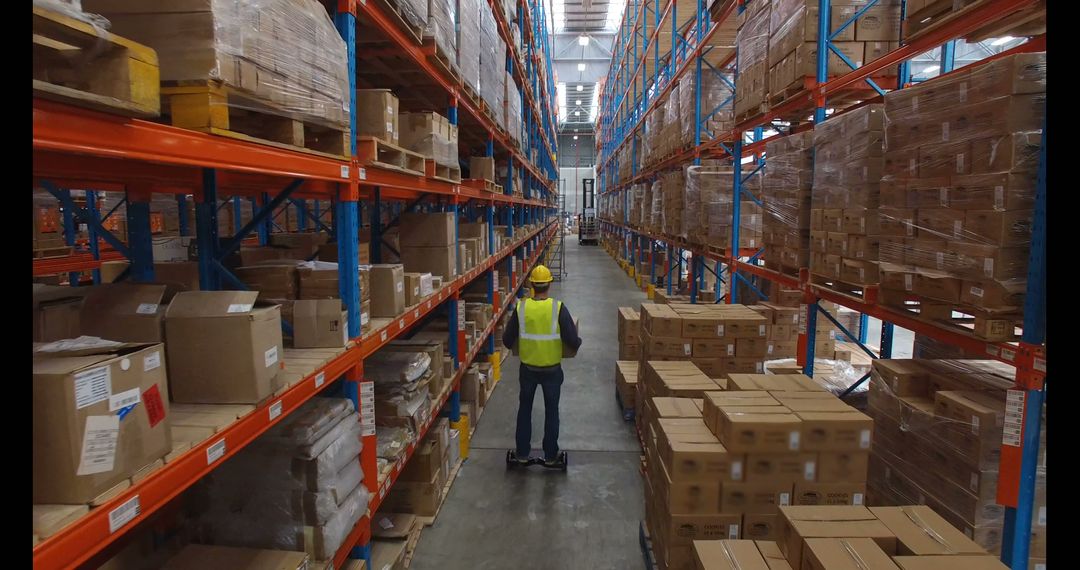
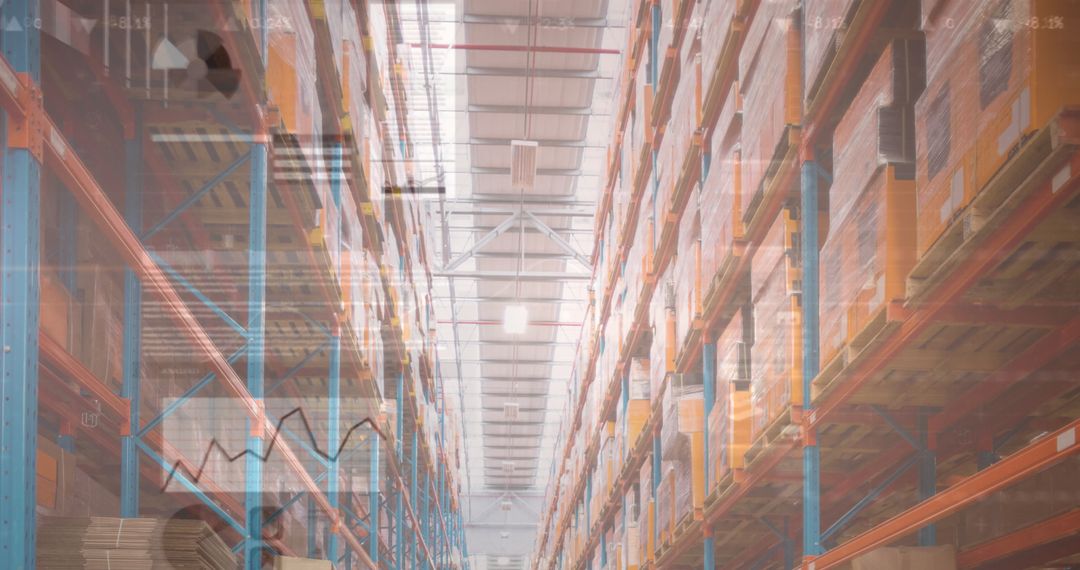
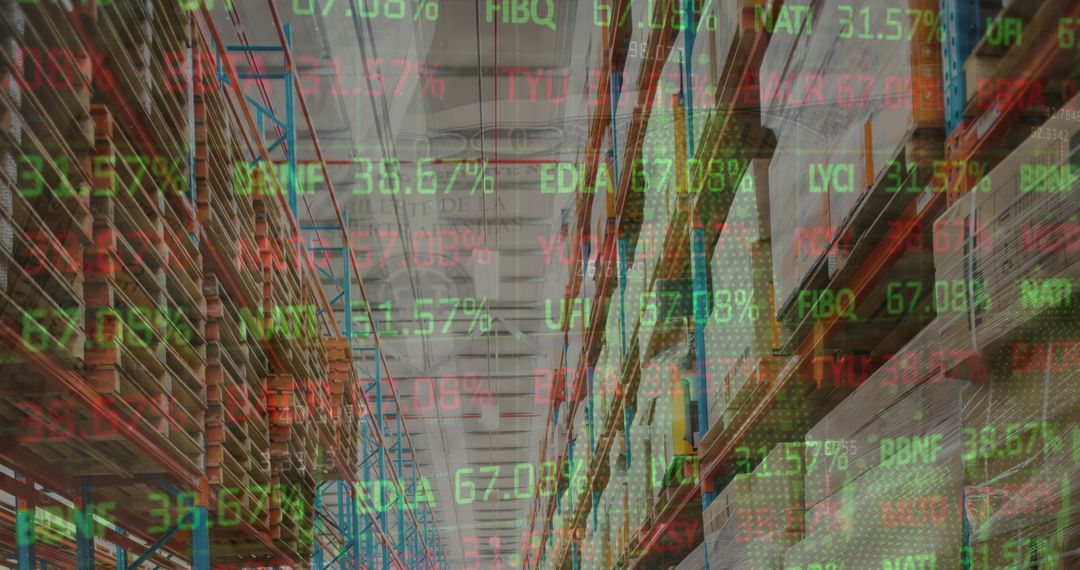
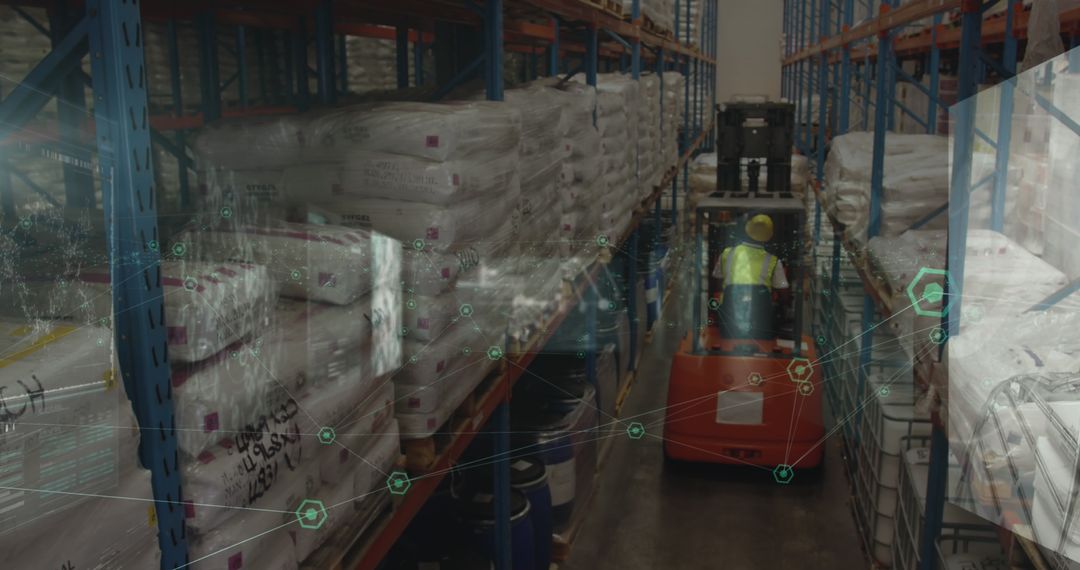
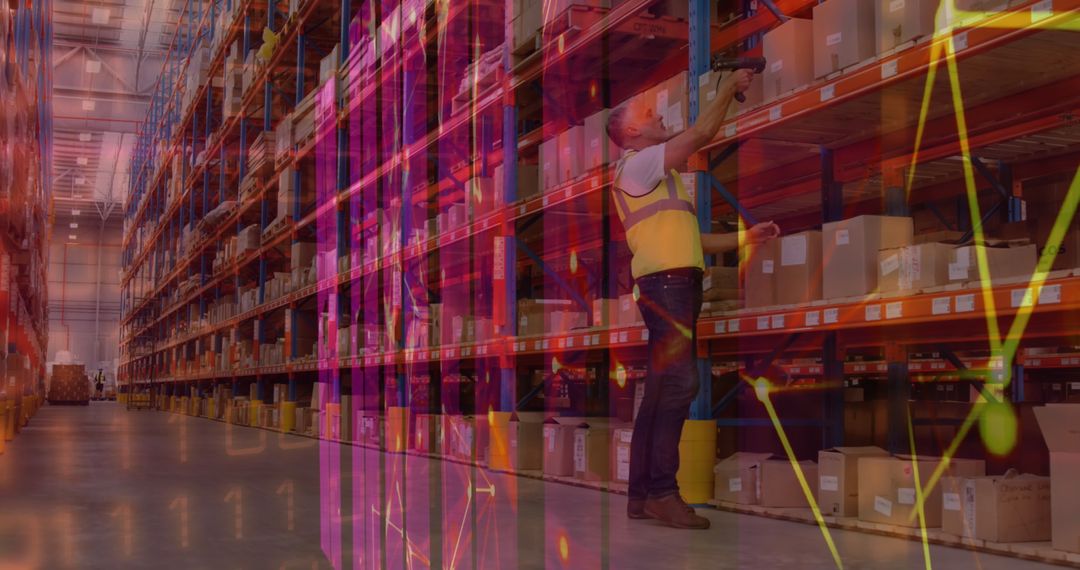
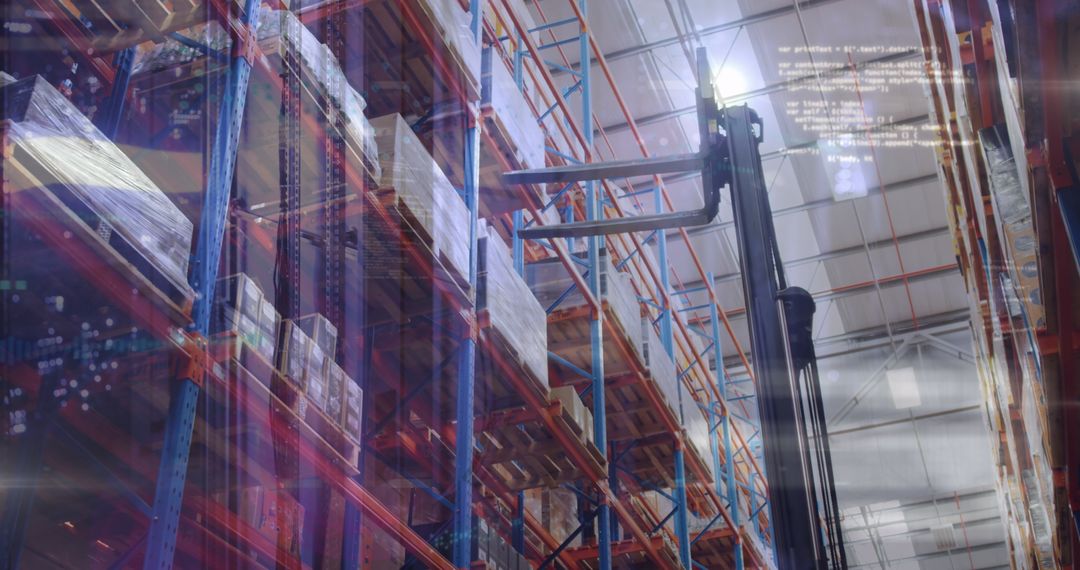
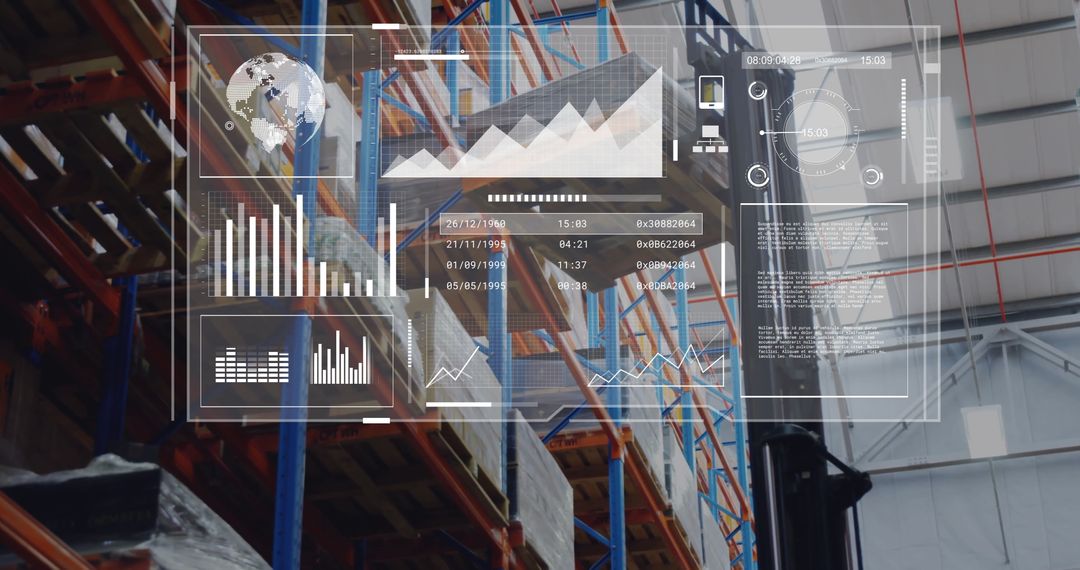
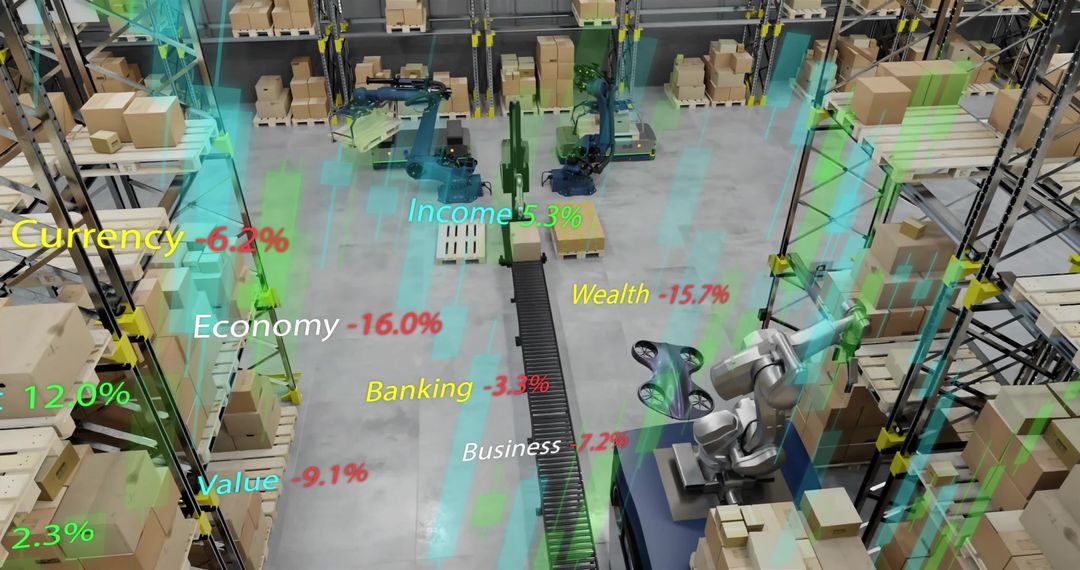
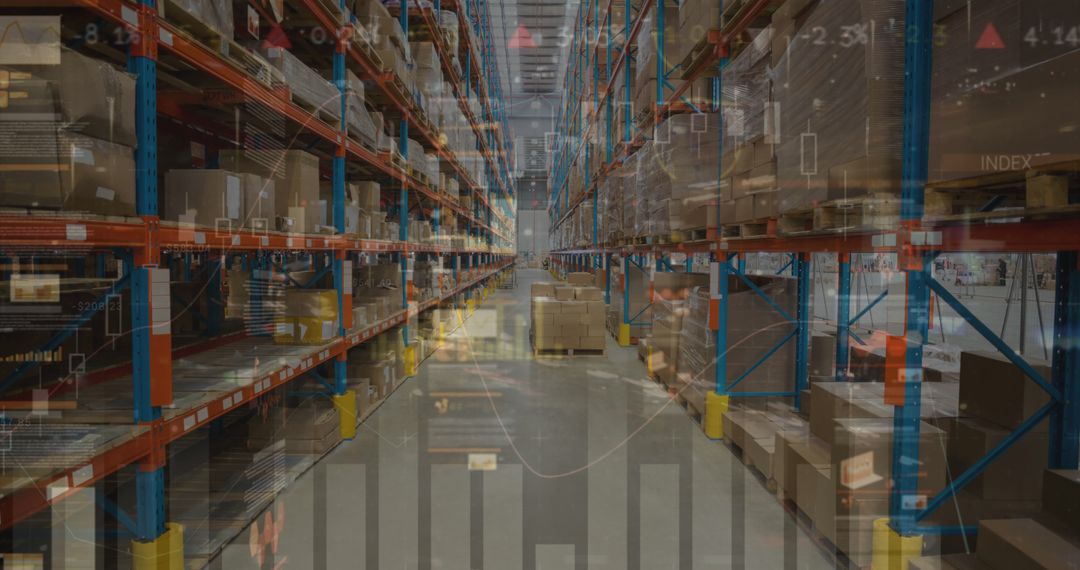
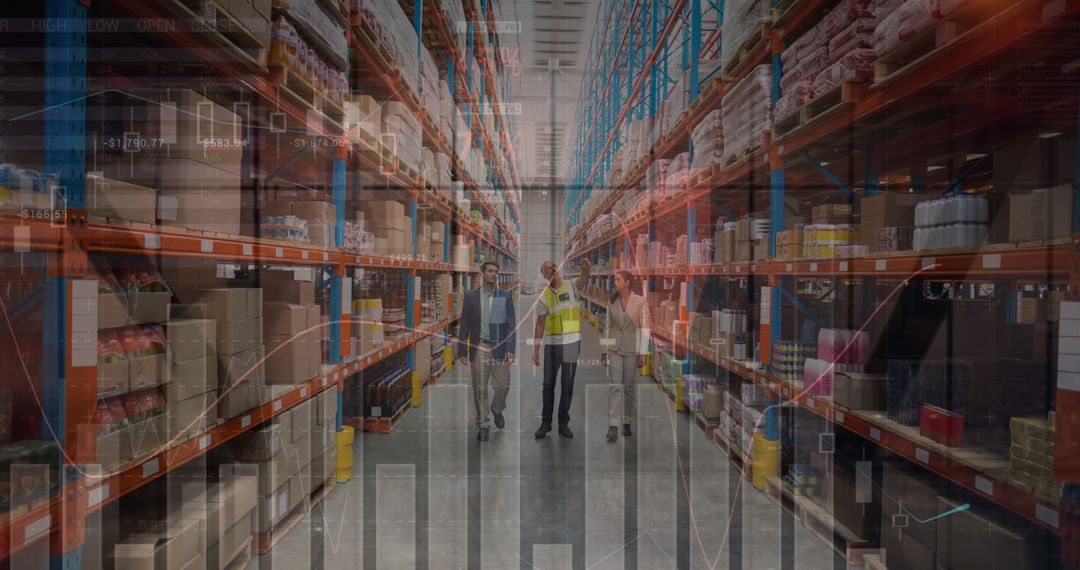
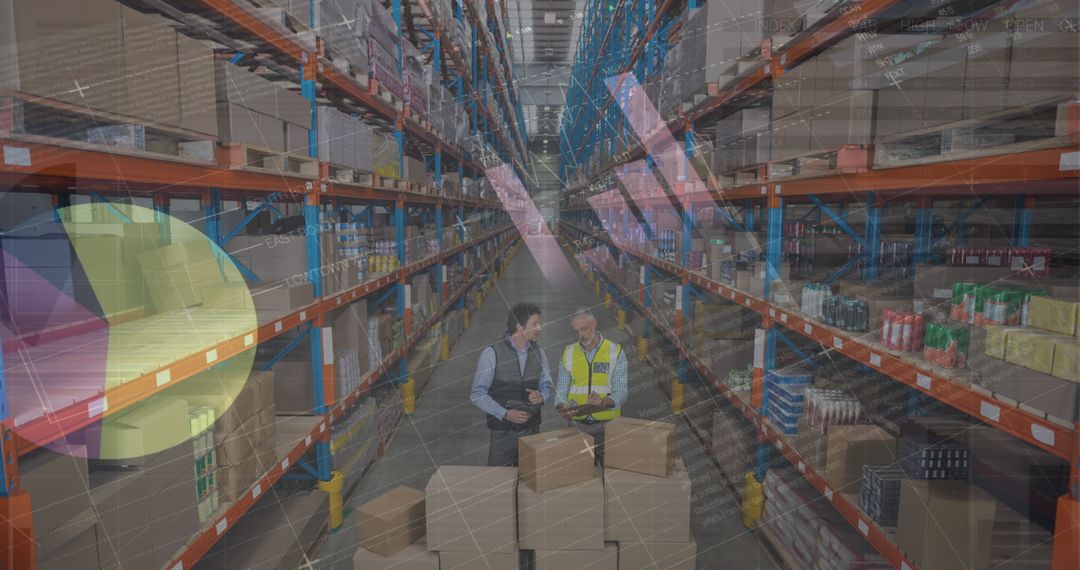
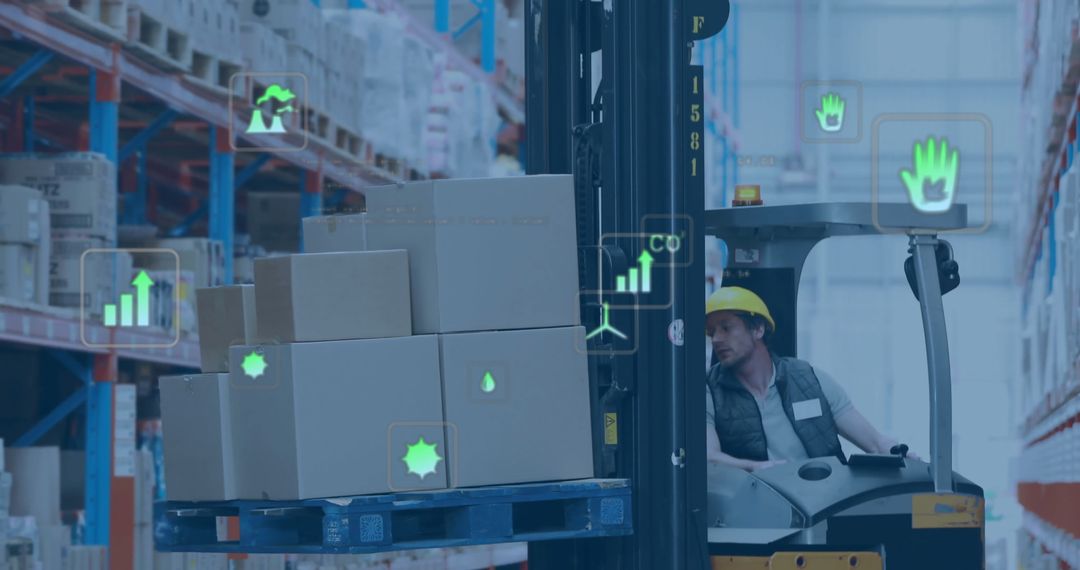
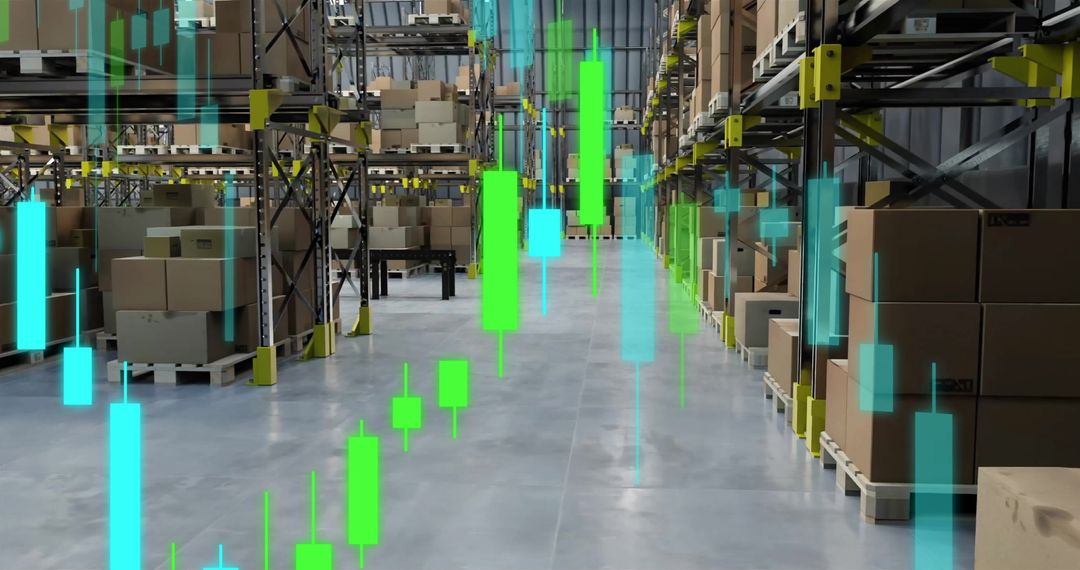
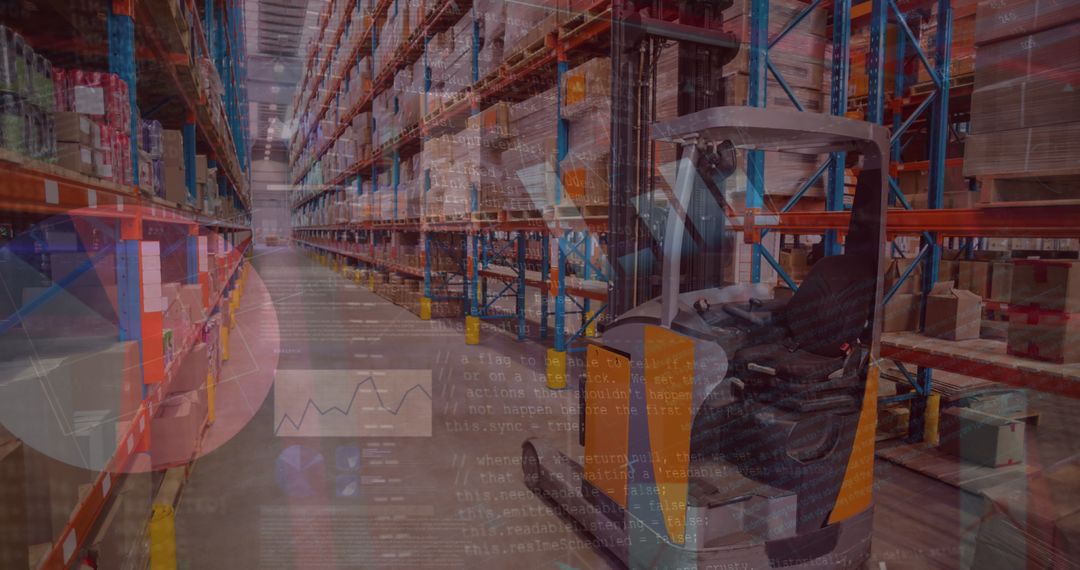
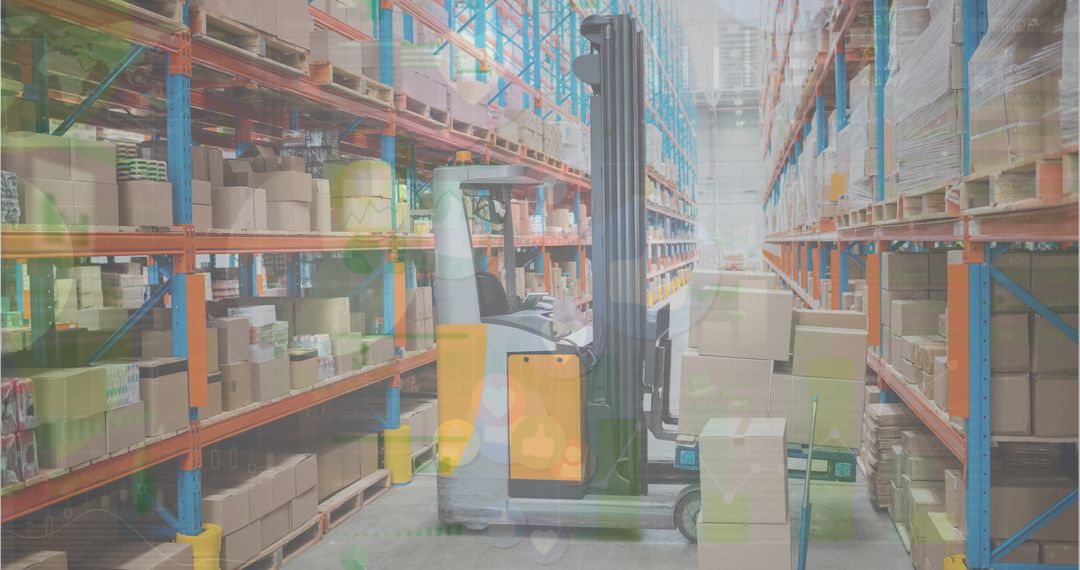
- Warehouse Automation with Stock Market and Economic Indicators Visualization
Warehouse Automation with Stock Market and Economic Indicators Visualization Image
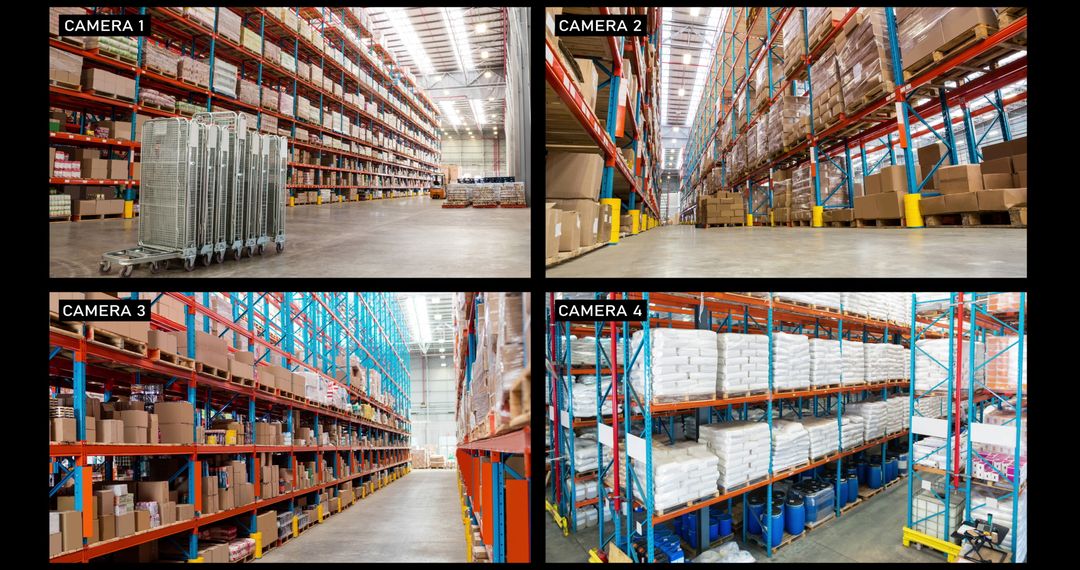
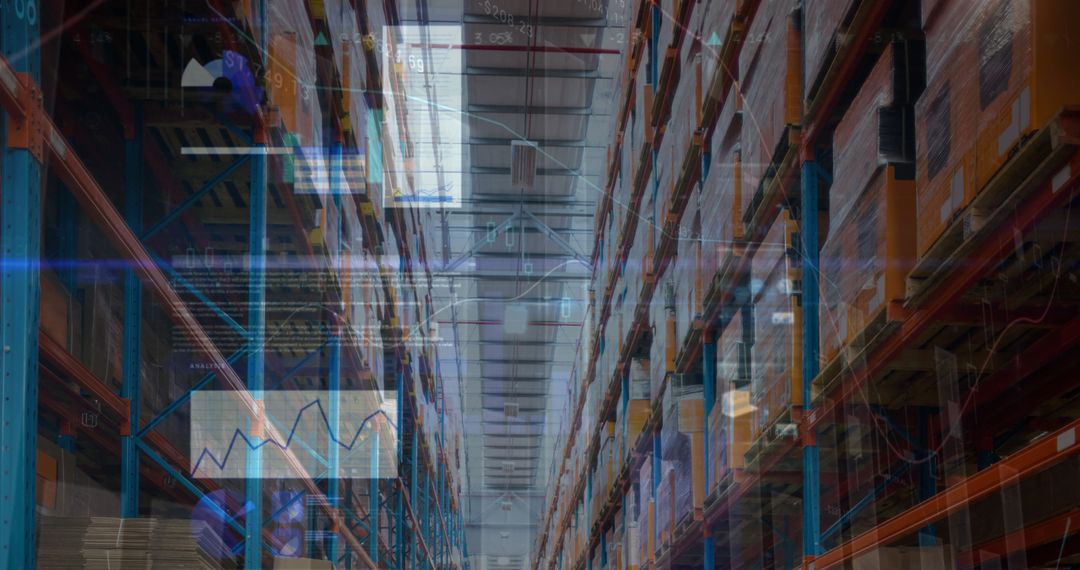
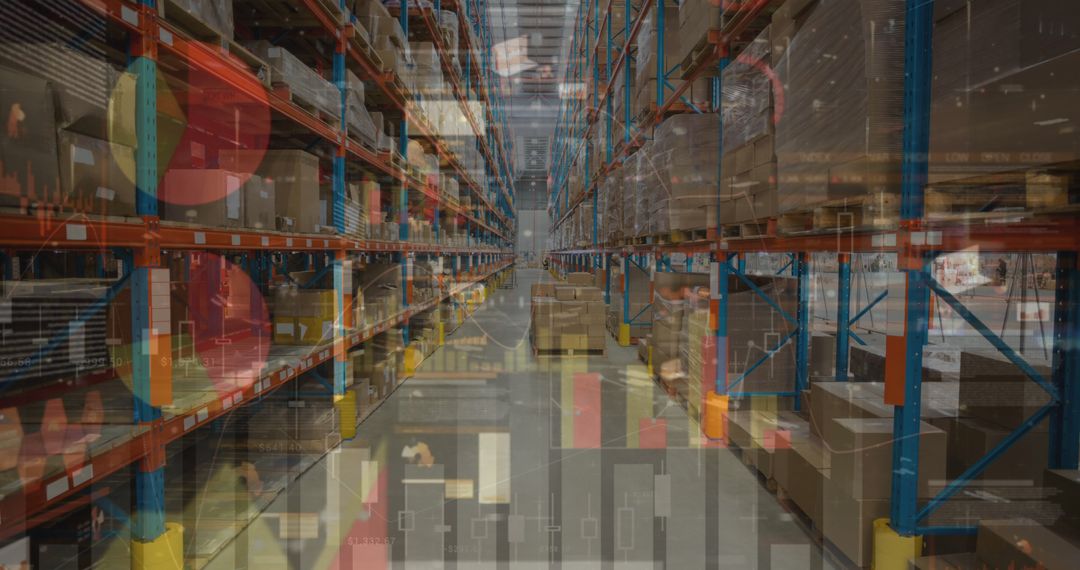
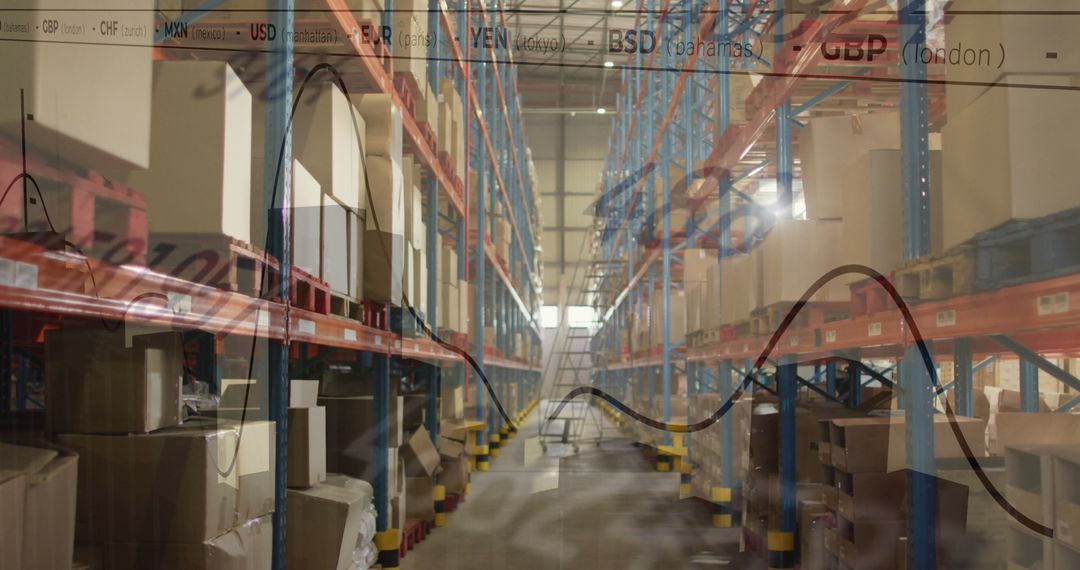
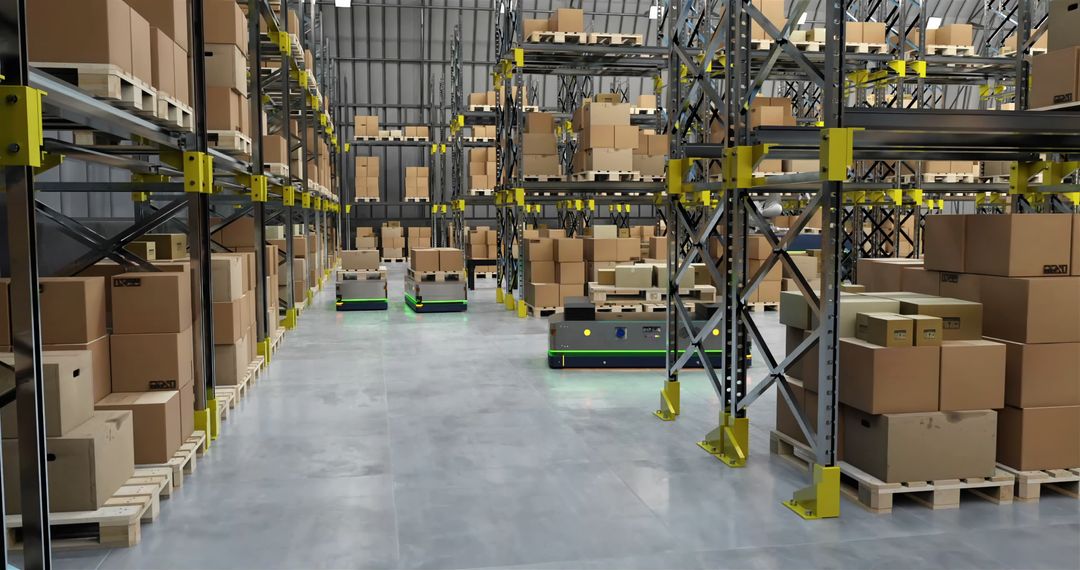
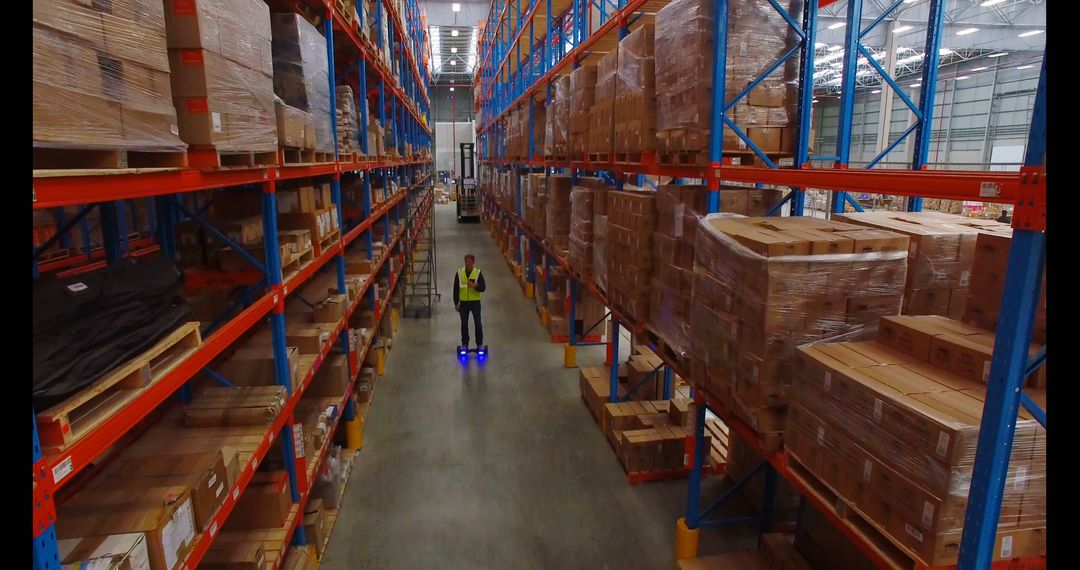
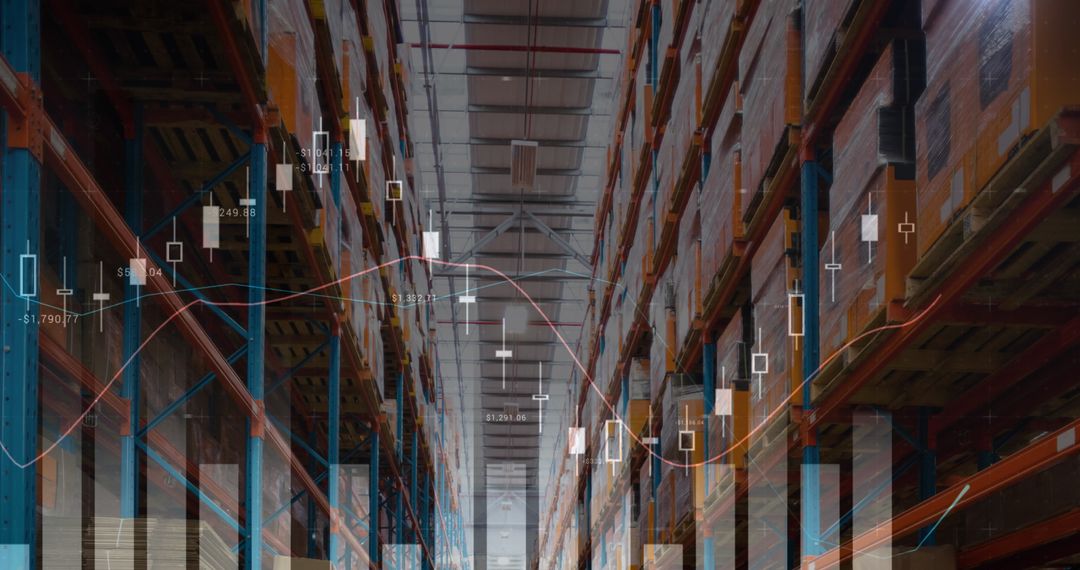
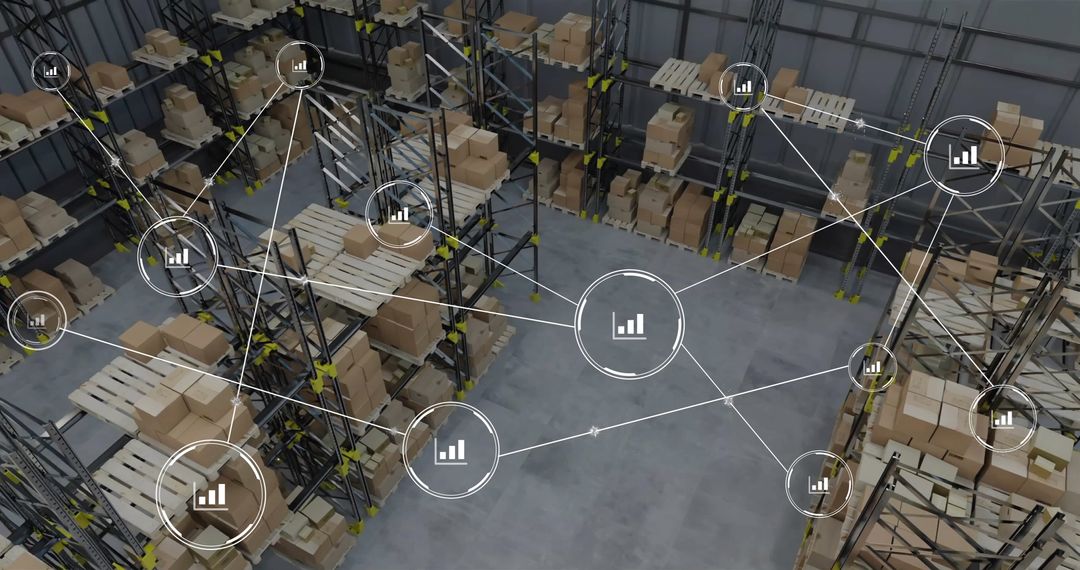
This image illustrates a modern warehouse integrated with digital visualizations of stock market data and economic indicators like inflation and GDP growth. It highlights the fusion of technology and economics in the logistics industry. This can be used in articles or presentations on international trade, economic trends, publication reports on technology infrastructure, futuristic business strategies, or data-driven solutions in supply chain management.
Powered by 


2
downloads
downloads
Tags:
More
Credit Photo
If you would like to credit the Photo, here are some ways you can do so
Text Link
photo Link
<span class="text-link">
<span>
<a target="_blank" href=https://pikwizard.com/photo/warehouse-automation-with-stock-market-and-economic-indicators-visualization/93ecc6f2f0d2f88d8efe935ef8275f77/>PikWizard</a>
</span>
</span>
<span class="image-link">
<span
style="margin: 0 0 20px 0; display: inline-block; vertical-align: middle; width: 100%;"
>
<a
target="_blank"
href="https://pikwizard.com/photo/warehouse-automation-with-stock-market-and-economic-indicators-visualization/93ecc6f2f0d2f88d8efe935ef8275f77/"
style="text-decoration: none; font-size: 10px; margin: 0;"
>
<img src="https://pikwizard.com/pw/medium/93ecc6f2f0d2f88d8efe935ef8275f77.jpg" style="margin: 0; width: 100%;" alt="" />
<p style="font-size: 12px; margin: 0;">PikWizard</p>
</a>
</span>
</span>
Free (free of charge)
Free for personal and commercial use.
Author: Awesome Content
Similar Free Stock Images