
- Home >
- Stock Photos >
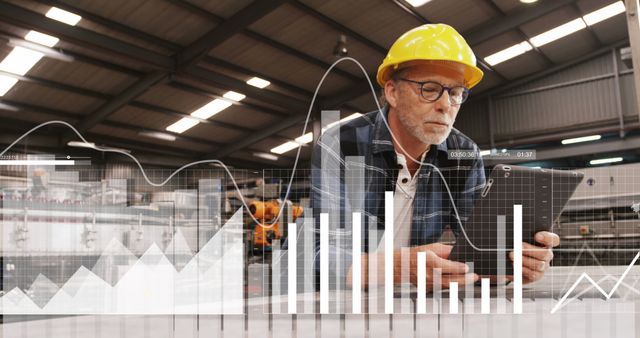
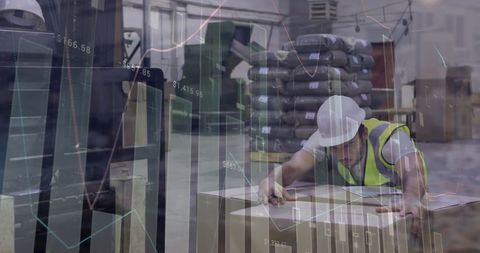
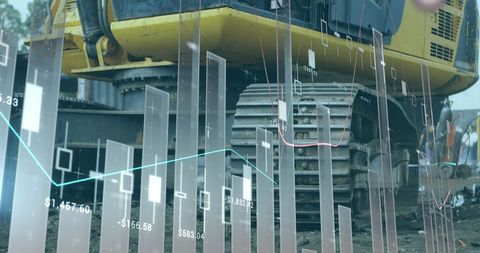
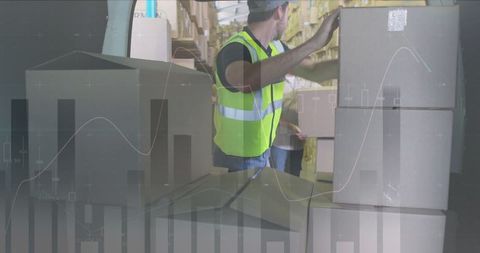
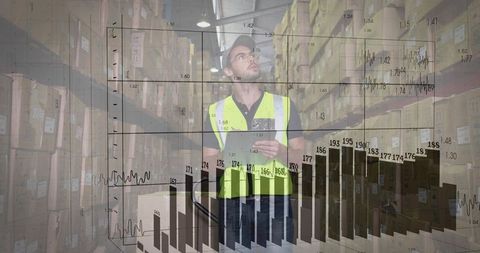
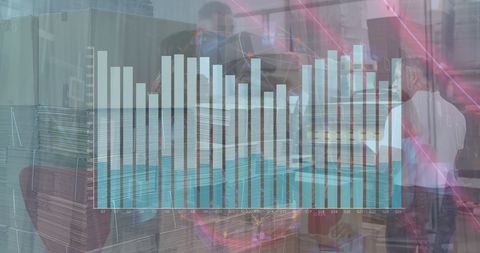
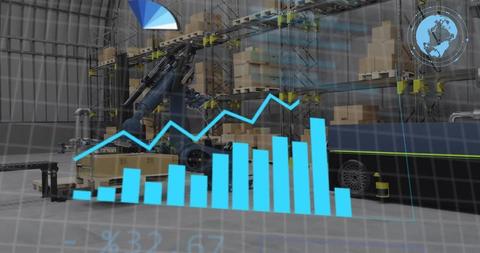
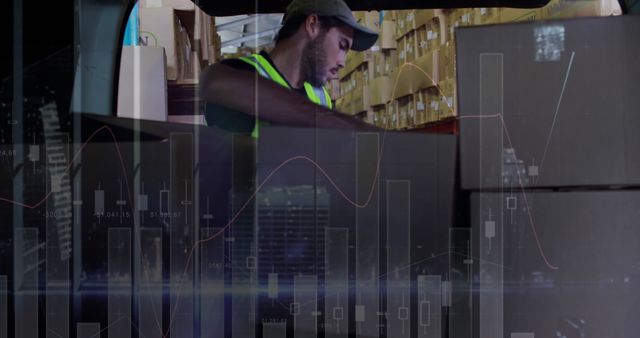
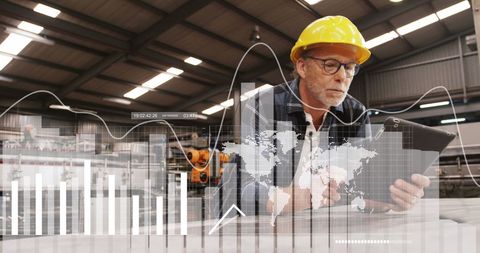
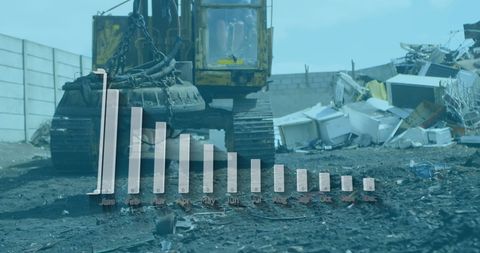
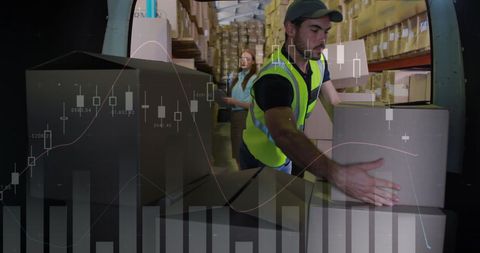
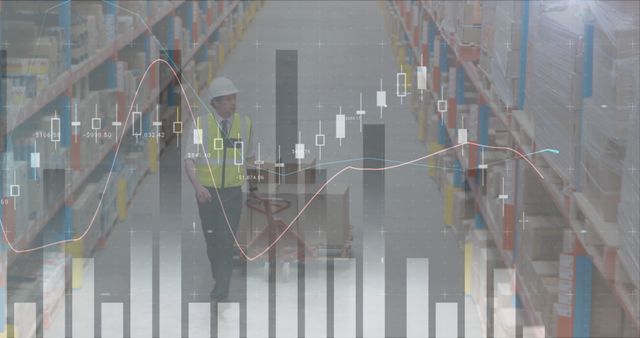
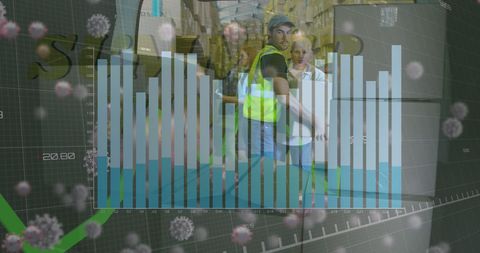
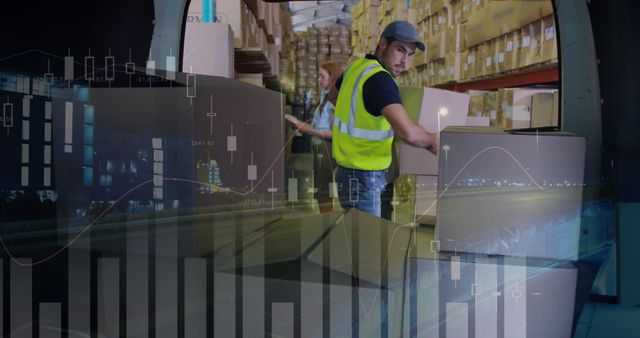
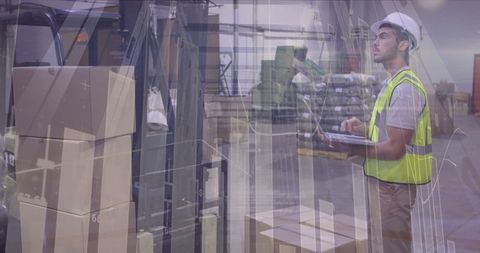
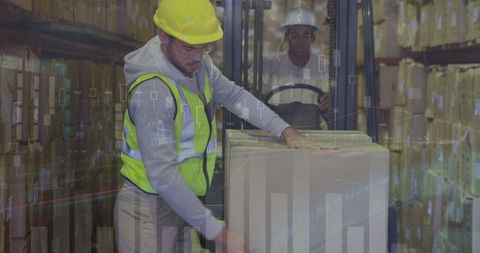
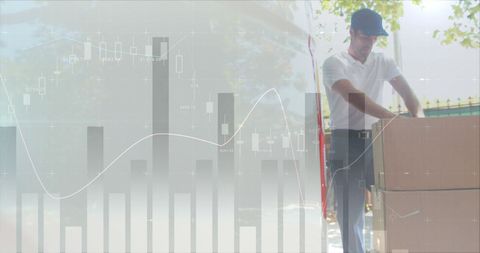
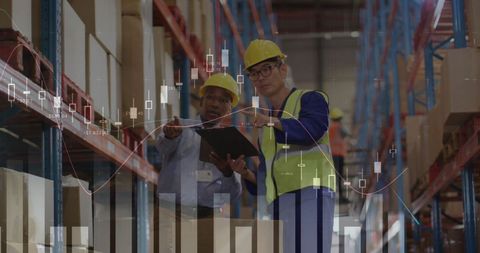
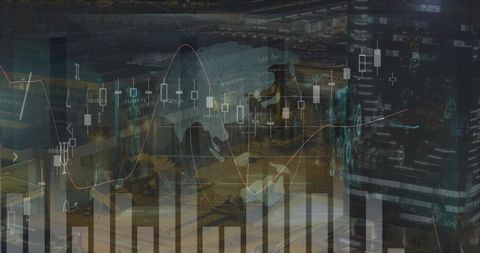
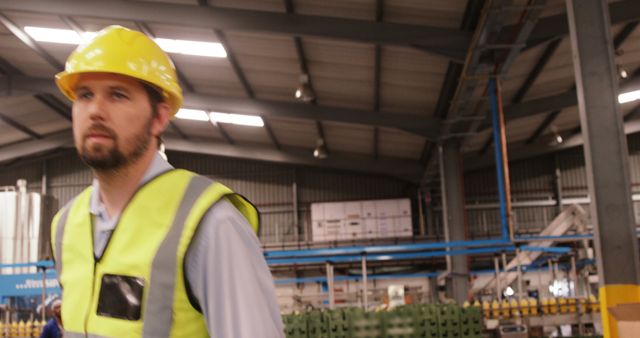
- Warehouse Efficiency with Overlayed Bar Graph Visualization
Warehouse Efficiency with Overlayed Bar Graph Visualization Image
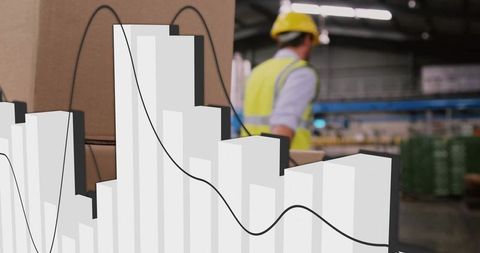
Image showcasing a worker wearing a safety helmet and vest, blurred to suggest focus on the overlay of a bar graph, representing various logistics and supply chain efficiencies. The blend of real-world and digital illustrates the integration of analytics in industrial operations. Useful for illustrating topics around warehouse management, supply chain optimization, logistics analytics, or technology in industrial operations.
Powered by  - Get 15% off with code: PIKWIZARD15


downloads
Tags:
More
Credit Photo
If you would like to credit the Photo, here are some ways you can do so
Text Link
photo Link
<span class="text-link">
<span>
<a target="_blank" href=https://pikwizard.com/photo/warehouse-efficiency-with-overlayed-bar-graph-visualization/fa7b2c18d756db1a44e114e0ab3e3d5f/>PikWizard</a>
</span>
</span>
<span class="image-link">
<span
style="margin: 0 0 20px 0; display: inline-block; vertical-align: middle; width: 100%;"
>
<a
target="_blank"
href="https://pikwizard.com/photo/warehouse-efficiency-with-overlayed-bar-graph-visualization/fa7b2c18d756db1a44e114e0ab3e3d5f/"
style="text-decoration: none; font-size: 10px; margin: 0;"
>
<img src="https://pikwizard.com/pw/medium/fa7b2c18d756db1a44e114e0ab3e3d5f.jpg" style="margin: 0; width: 100%;" alt="" />
<p style="font-size: 12px; margin: 0;">PikWizard</p>
</a>
</span>
</span>
Free (free of charge)
Free for personal and commercial use.
Author: Authentic Images
Similar Free Stock Images
Premium


Premium
Premium


Premium


Premium


Premium


Premium


Premium

Premium

Premium

Premium


Premium


Premium


Premium


Premium


Premium


Premium

Premium


Premium


Premium


Premium


Premium


Premium

Premium


Premium

Explore More Free Stock Images