- Home >
- Stock Photos >
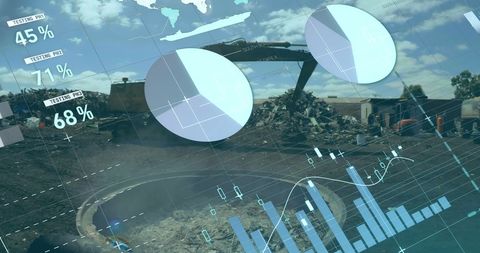
- Warehouse Operations Amid Global Financial Analysis Overlay
Warehouse Operations Amid Global Financial Analysis Overlay Image

Depicts interaction between warehouse operations and global financial markets, showing how business strategy and commerce are influenced by data analysis. Useful for illustrating concepts of international trade, logistics, and economic forecasting in articles, presentations, and business reports.
Powered by 


2
downloads
downloads
Tags:
More
Credit Photo
If you would like to credit the Photo, here are some ways you can do so
Text Link
photo Link
<span class="text-link">
<span>
<a target="_blank" href=https://pikwizard.com/photo/warehouse-operations-amid-global-financial-analysis-overlay/8f020c237e4e8cb0b78c596f0954626a/>PikWizard</a>
</span>
</span>
<span class="image-link">
<span
style="margin: 0 0 20px 0; display: inline-block; vertical-align: middle; width: 100%;"
>
<a
target="_blank"
href="https://pikwizard.com/photo/warehouse-operations-amid-global-financial-analysis-overlay/8f020c237e4e8cb0b78c596f0954626a/"
style="text-decoration: none; font-size: 10px; margin: 0;"
>
<img src="https://pikwizard.com/pw/medium/8f020c237e4e8cb0b78c596f0954626a.jpg" style="margin: 0; width: 100%;" alt="" />
<p style="font-size: 12px; margin: 0;">PikWizard</p>
</a>
</span>
</span>
Free (free of charge)
Free for personal and commercial use.
Author: People Creations
Similar Free Stock Images
Loading...

Premium


Premium

Premium


Premium

Premium


Premium


Premium


Premium


Premium


Premium


Premium


Premium

Premium

Premium


Premium


Premium


Premium


Premium


Premium


Premium


Premium


Premium

Premium


Premium


Premium