- Home >
- Stock Photos >
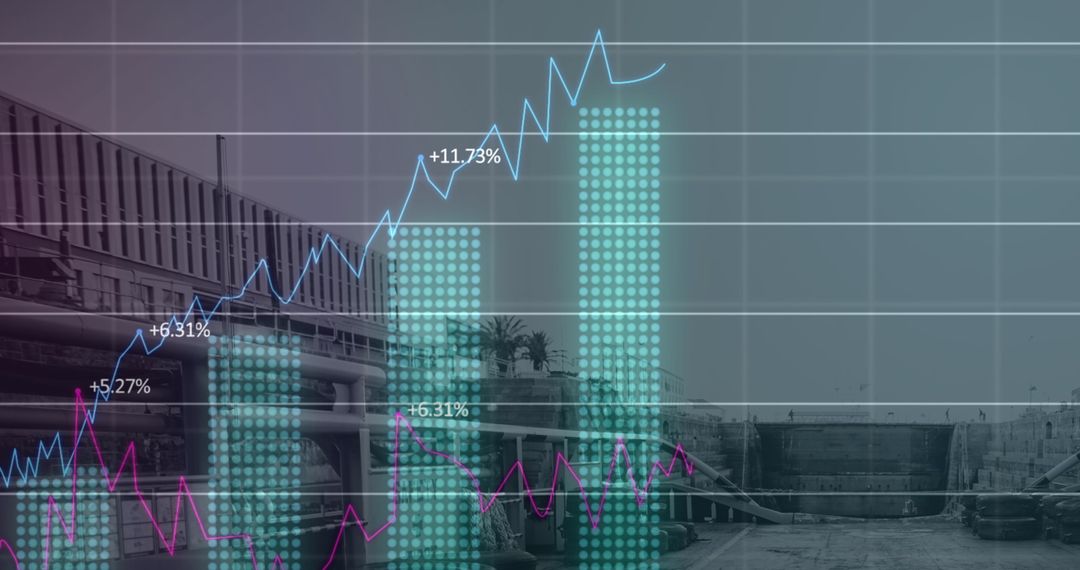
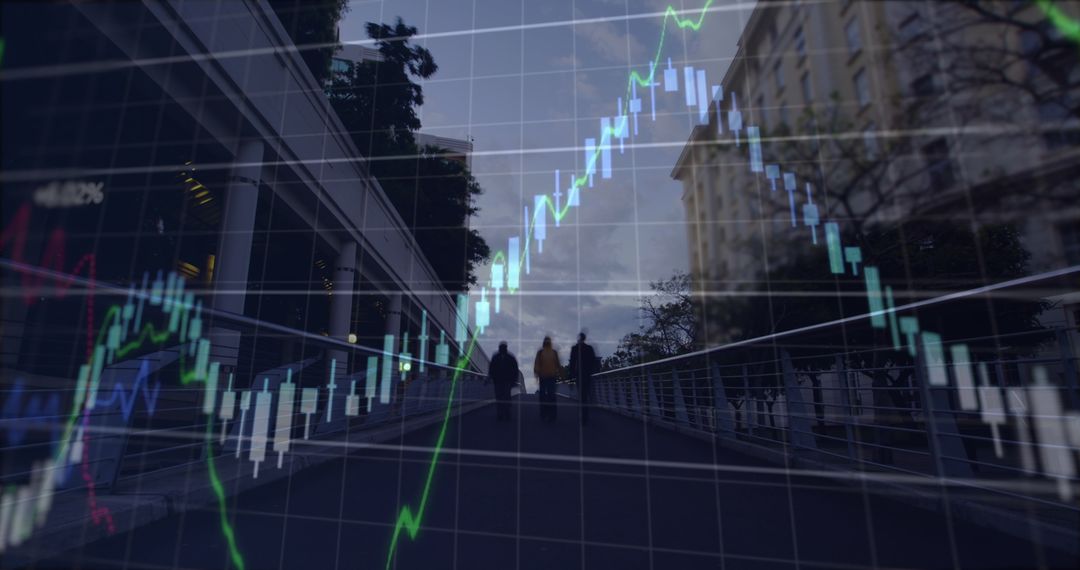
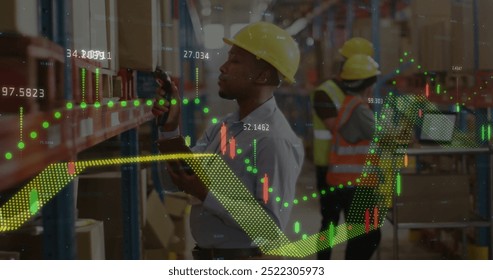
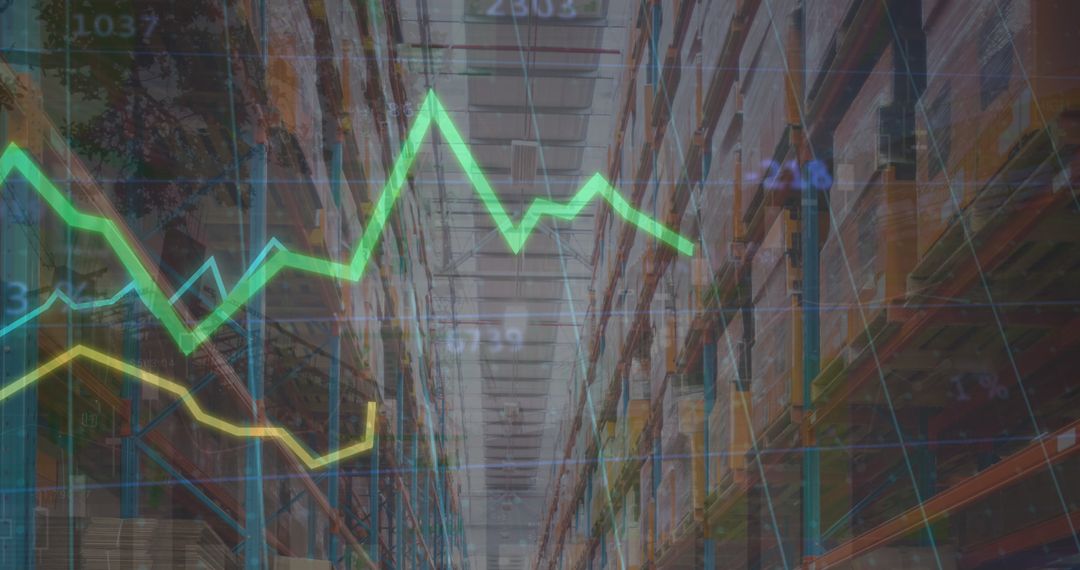
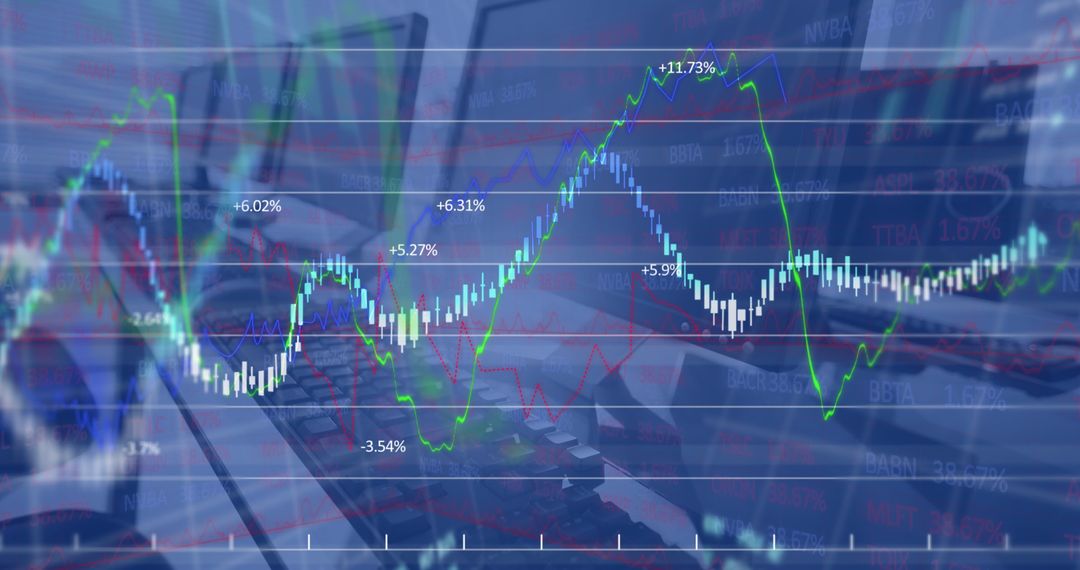
- Warehouse with Superimposed Financial Analytics Charts and Graphs
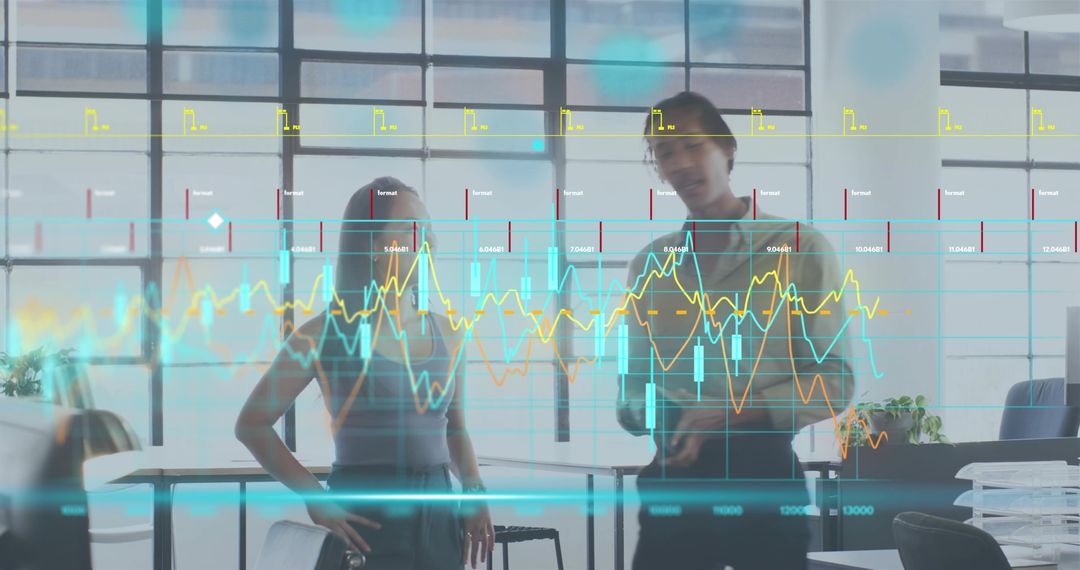
Warehouse with Superimposed Financial Analytics Charts and Graphs Image
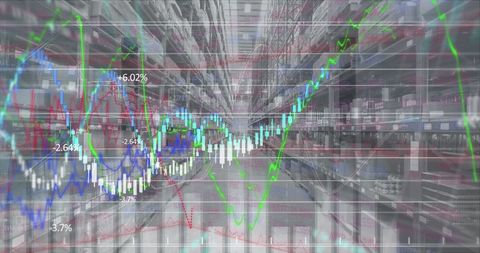
This image shows an expansive warehouse background with various financial data elements, including charts and graphs, superimposed over it, indicating financial analysis and statistics processing. This visual can be used in business presentations, financial reports, and marketing materials related to supply chain management, stock tracking, or economic growth. It can appeal to audiences keen on global finances or looking to illustrate market trends and business intent.
Powered by  - Get 15% off with code: PIKWIZARD15


2
downloads
downloads
Tags:
More
Credit Photo
If you would like to credit the Photo, here are some ways you can do so
Text Link
photo Link
<span class="text-link">
<span>
<a target="_blank" href=https://pikwizard.com/photo/warehouse-with-superimposed-financial-analytics-charts-and-graphs/868dfe2fc836070cdff525f8477ee317/>PikWizard</a>
</span>
</span>
<span class="image-link">
<span
style="margin: 0 0 20px 0; display: inline-block; vertical-align: middle; width: 100%;"
>
<a
target="_blank"
href="https://pikwizard.com/photo/warehouse-with-superimposed-financial-analytics-charts-and-graphs/868dfe2fc836070cdff525f8477ee317/"
style="text-decoration: none; font-size: 10px; margin: 0;"
>
<img src="https://pikwizard.com/pw/medium/868dfe2fc836070cdff525f8477ee317.jpg" style="margin: 0; width: 100%;" alt="" />
<p style="font-size: 12px; margin: 0;">PikWizard</p>
</a>
</span>
</span>
Free (free of charge)
Free for personal and commercial use.
Author: Authentic Images
Similar Free Stock Images

Premium


Premium


Premium


Premium


Premium


Premium


Premium


Premium


Premium


Premium


Premium


Premium


Premium


Premium


Premium


Premium


Premium


Premium


Premium


Premium


Premium


Premium


Premium


Premium