- Home >
- Stock Photos >
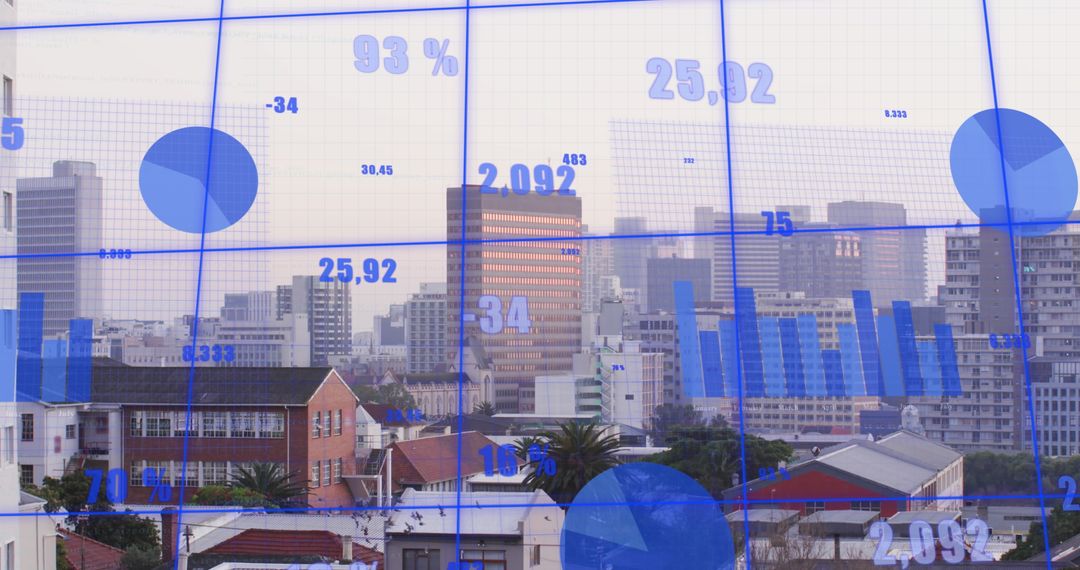
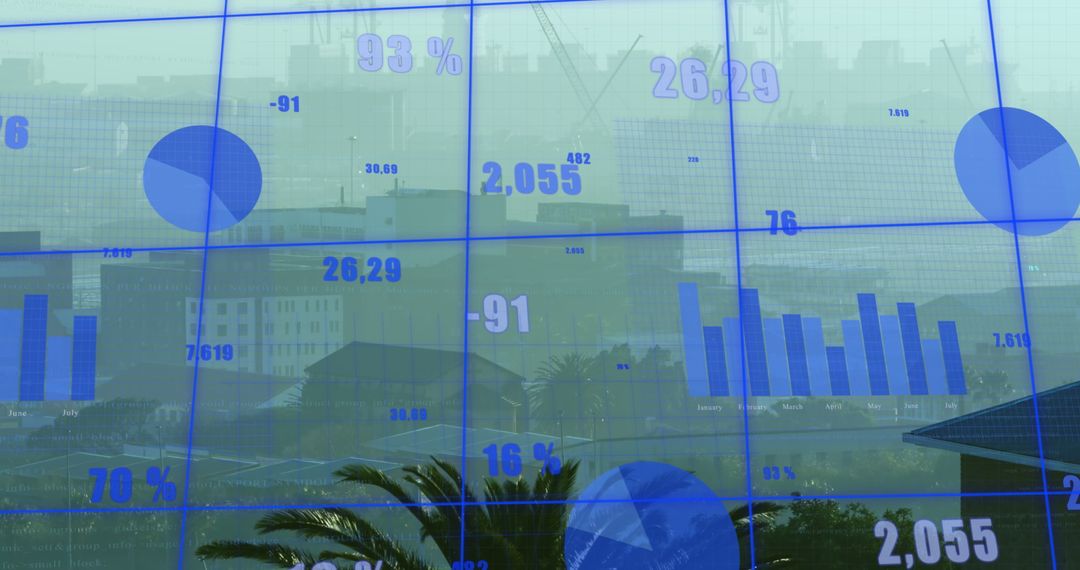
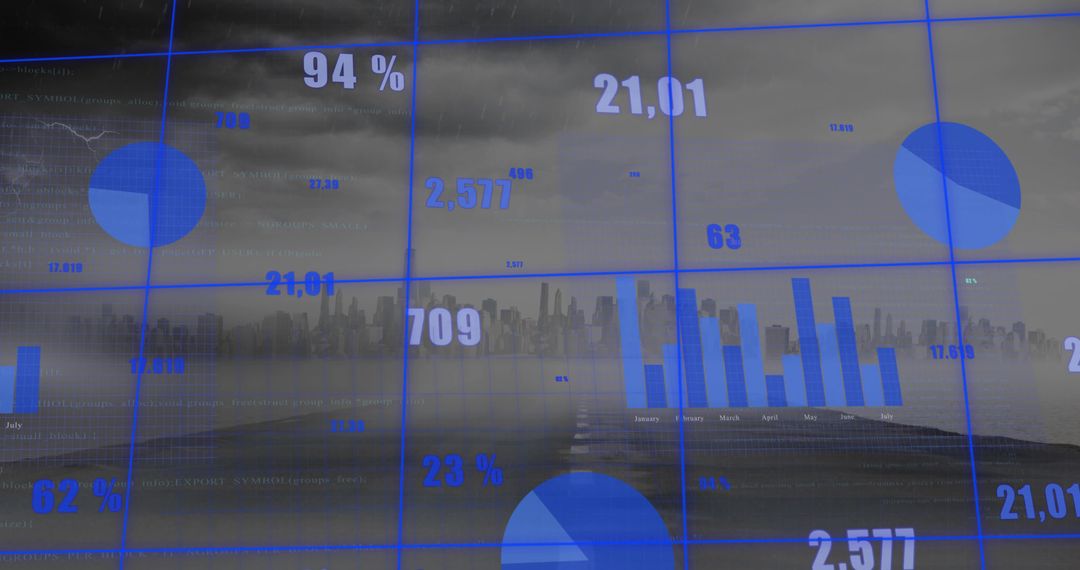
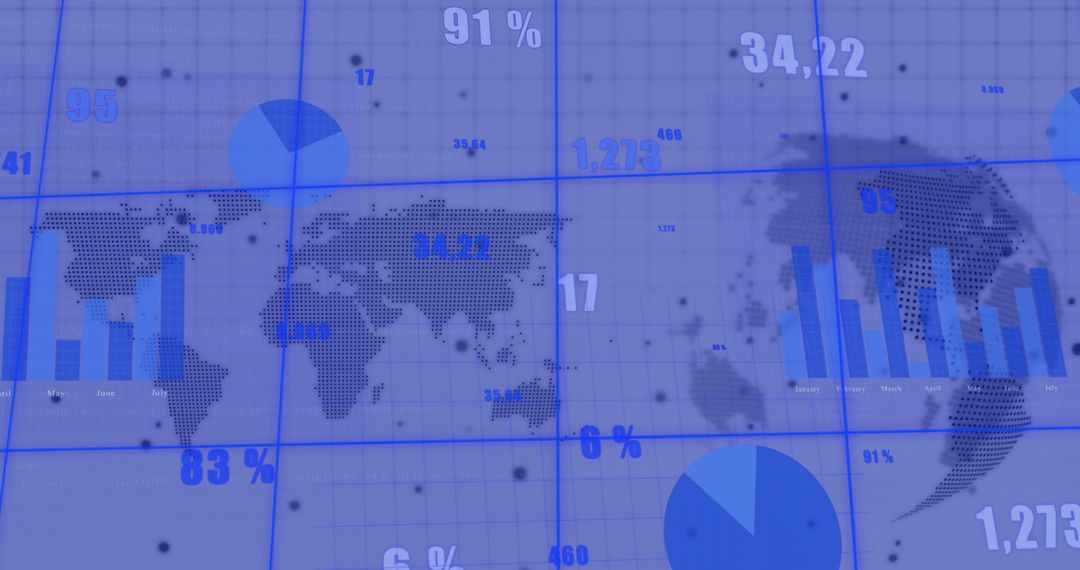
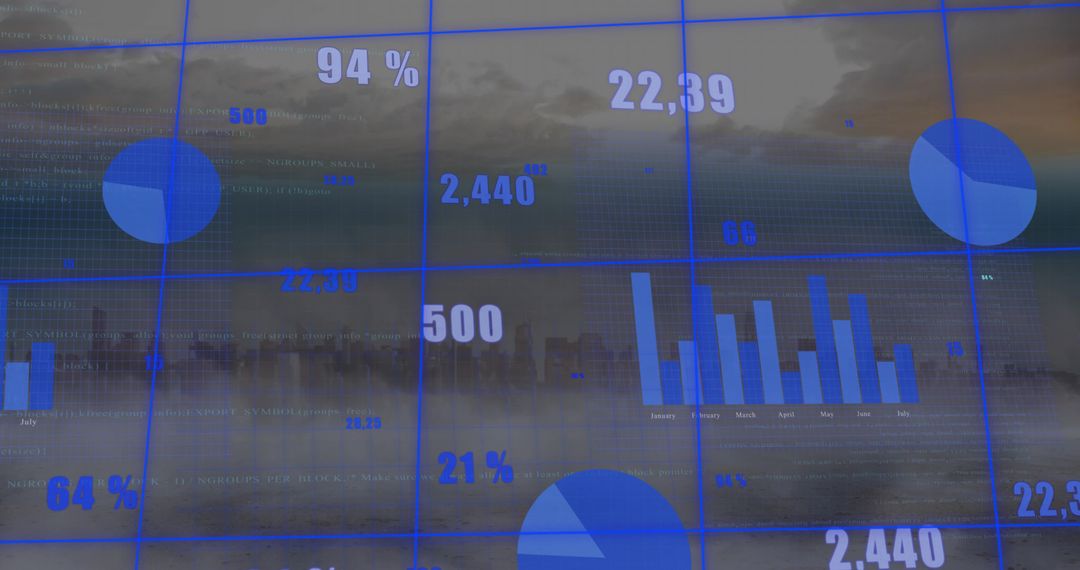
- Waves crashing under digital analytics overlay, blue charts and pie graphs merging with seascape
Waves crashing under digital analytics overlay, blue charts and pie graphs merging with seascape Image
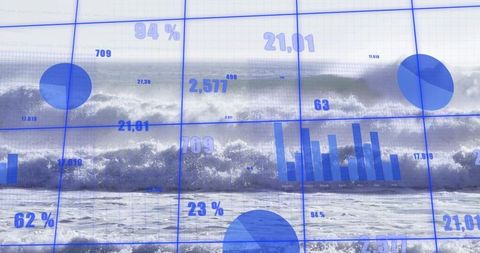
Depicting breaking waves overlaid with translucent blue dashboard elements including bar charts, pie graphs, percentage figures and grid lines. Blending natural seascape with digital analytics, creating contrast between ocean motion and structured data. Ideal for illustrating coastal risk, visualizing climate data, conveying financial volatility or market trends, promoting analytics software, and enhancing technology or business presentations. Suitable for website hero banners, report covers, slide decks, social media visuals, editorial features on blue economy, environmental monitoring, insurance and risk management materials. Colour palette and composition supporting overlaying text, logos and branding for marketing or corporate use.
Powered by  - Get 15% off with code: PIKWIZARD15


0
downloads
downloads
Tags:
More
Credit Photo
If you would like to credit the Photo, here are some ways you can do so
Text Link
photo Link
<span class="text-link">
<span>
<a target="_blank" href=https://pikwizard.com/photo/waves-crashing-under-digital-analytics-overlay-blue-charts-and-pie-graphs-merging-with-seascape/9ab080d6bf50c6d96cec4dde12a8ed87/>PikWizard</a>
</span>
</span>
<span class="image-link">
<span
style="margin: 0 0 20px 0; display: inline-block; vertical-align: middle; width: 100%;"
>
<a
target="_blank"
href="https://pikwizard.com/photo/waves-crashing-under-digital-analytics-overlay-blue-charts-and-pie-graphs-merging-with-seascape/9ab080d6bf50c6d96cec4dde12a8ed87/"
style="text-decoration: none; font-size: 10px; margin: 0;"
>
<img src="https://pikwizard.com/pw/medium/9ab080d6bf50c6d96cec4dde12a8ed87.jpg" style="margin: 0; width: 100%;" alt="" />
<p style="font-size: 12px; margin: 0;">PikWizard</p>
</a>
</span>
</span>
Free (free of charge)
Free for personal and commercial use.
Author: Authentic Images
Similar Free Stock Images
Premium

Premium


Premium


Premium


Premium


Premium


Premium


Premium


Premium


Premium


Premium


Premium


Premium


Premium


Premium


Premium


Premium


Premium


Premium


Premium


Premium


Premium


Premium


Premium