
- Home >
- Free Stock Photos & Images >
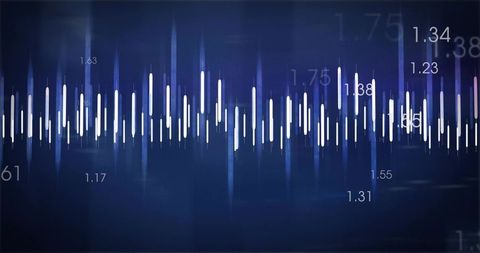
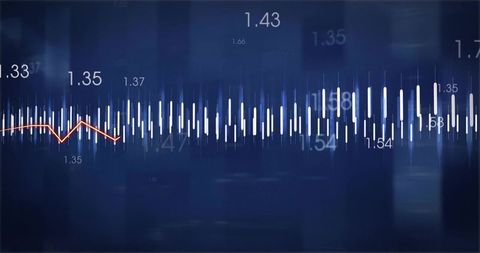
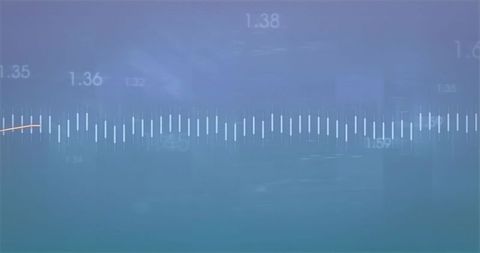
- White-Bar Waveform Visualizing Data Pulses with Teal Nodes on Dark Blue Analytics Display
White-Bar Waveform Visualizing Data Pulses with Teal Nodes on Dark Blue Analytics Display Free Stock Image

Abstract tech composition showing central white-bar waveform moving across dark blue display with teal circular nodes and blurred code overlay. High-contrast neon glow and motion blur creating sense of depth and data flow. Ideal for use in fintech, data analytics, machine learning, cybersecurity, and broadcast audio visual branding. Serving as hero header, presentation slide, website banner, marketing brochure, app UI mockup, or editorial illustration for technology and finance topics. Editable color palette and shallow focus allowing overlaying of text and logos while maintaining visual energy. Stock-friendly composition supporting landscape layouts and widescreen formats.
Powered by  - Get 15% off with code: PIKWIZARD15


downloads
Tags:
More
Credit Photo
If you would like to credit the Photo, here are some ways you can do so
Text Link
photo Link
<span class="text-link">
<span>
<a target="_blank" href=https://pikwizard.com/photo/white-bar-waveform-visualizing-data-pulses-with-teal-nodes-on-dark-blue-analytics-display/ccfc0fb6012572e00b93d03830ce0f43/>PikWizard</a>
</span>
</span>
<span class="image-link">
<span
style="margin: 0 0 20px 0; display: inline-block; vertical-align: middle; width: 100%;"
>
<a
target="_blank"
href="https://pikwizard.com/photo/white-bar-waveform-visualizing-data-pulses-with-teal-nodes-on-dark-blue-analytics-display/ccfc0fb6012572e00b93d03830ce0f43/"
style="text-decoration: none; font-size: 10px; margin: 0;"
>
<img src="https://thumbs.wbm.im/pw/medium/ccfc0fb6012572e00b93d03830ce0f43.jpg" style="margin: 0; width: 100%;" alt="White-Bar Waveform Visualizing Data Pulses with Teal Nodes on Dark Blue Analytics Display" />
<p style="font-size: 12px; margin: 0;">PikWizard</p>
</a>
</span>
</span>
Free (free of charge)
Free for personal and commercial use.
Author: Authentic Images
Similar Free Stock Images


Premium


Premium


Premium


Premium


Premium


Premium


Premium


Premium


Premium


Premium


Premium


Premium


Premium


Premium


Premium


Premium


Premium


Premium


Premium


Premium


Premium


Premium


Premium


Premium


Premium

Explore More Free Stock Images