- Home >
- Stock Photos >
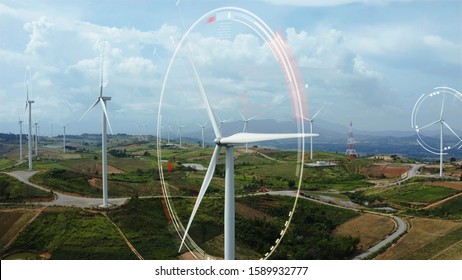
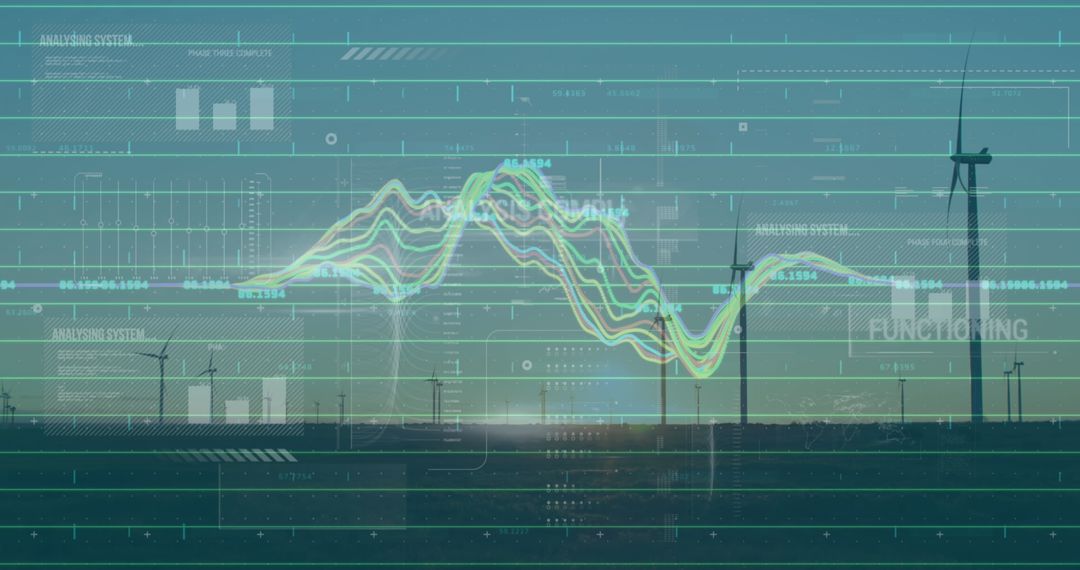
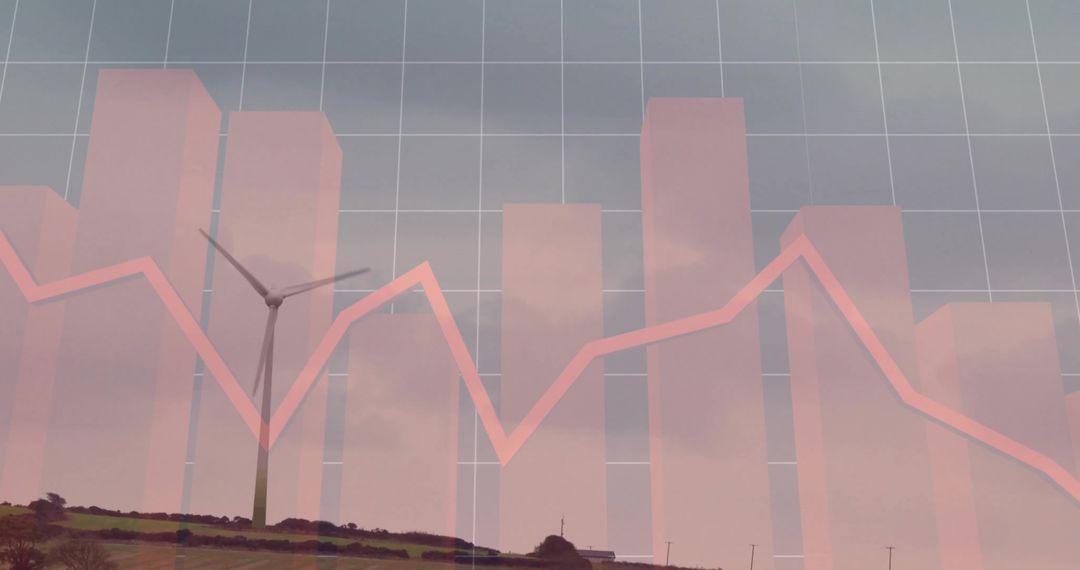
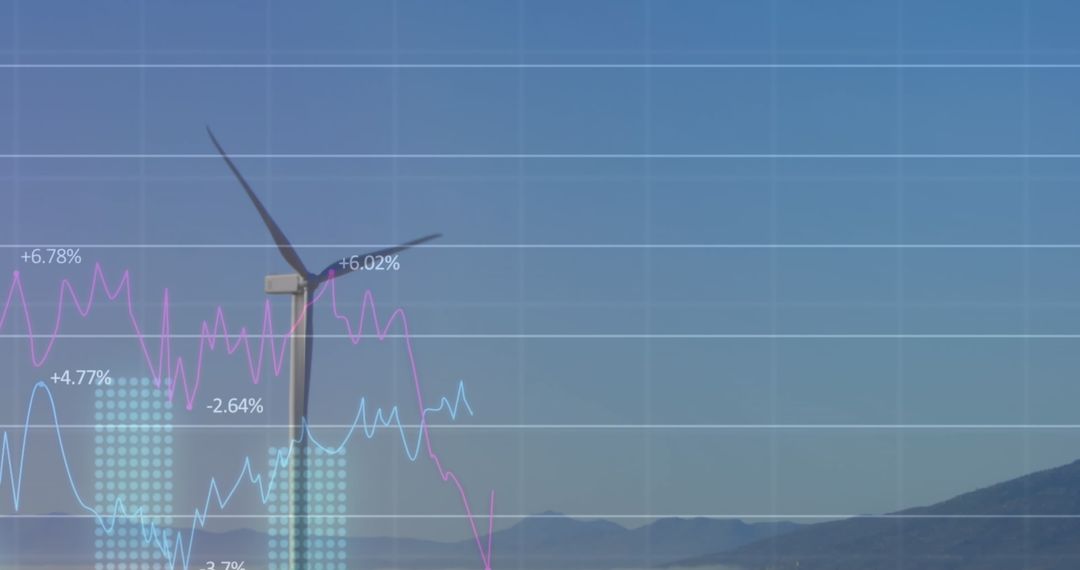
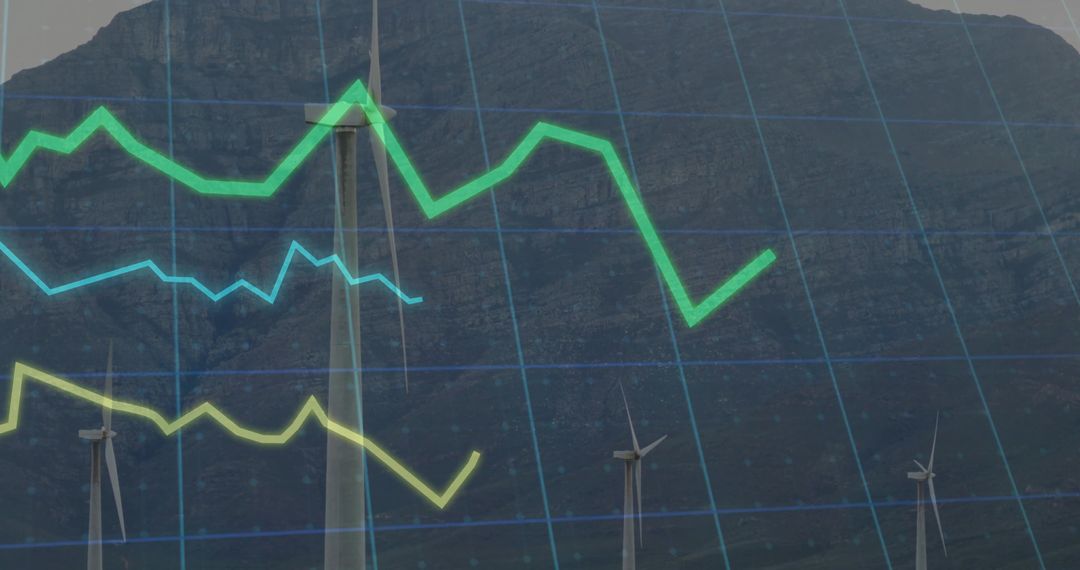
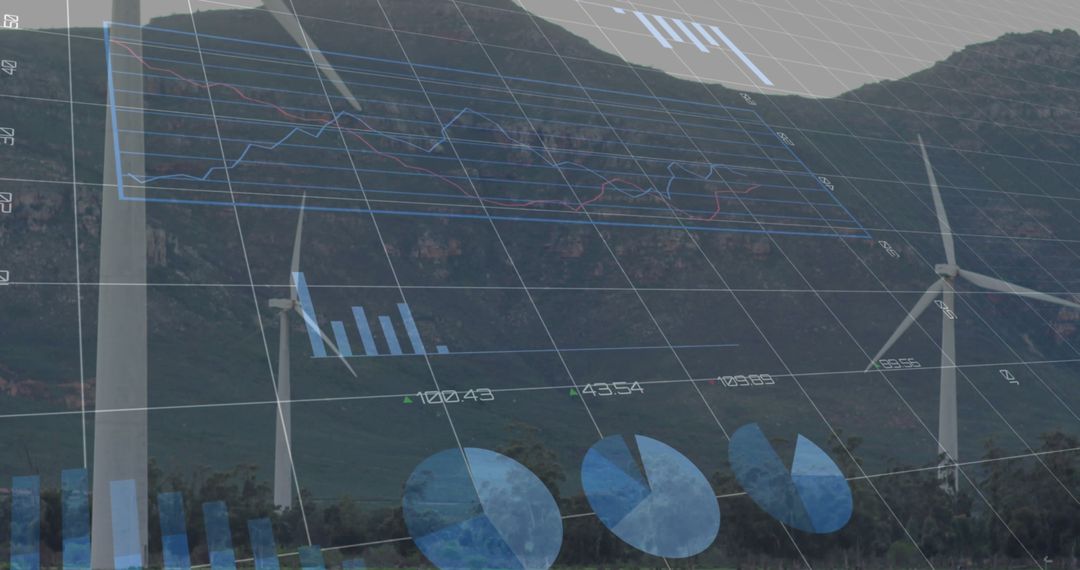
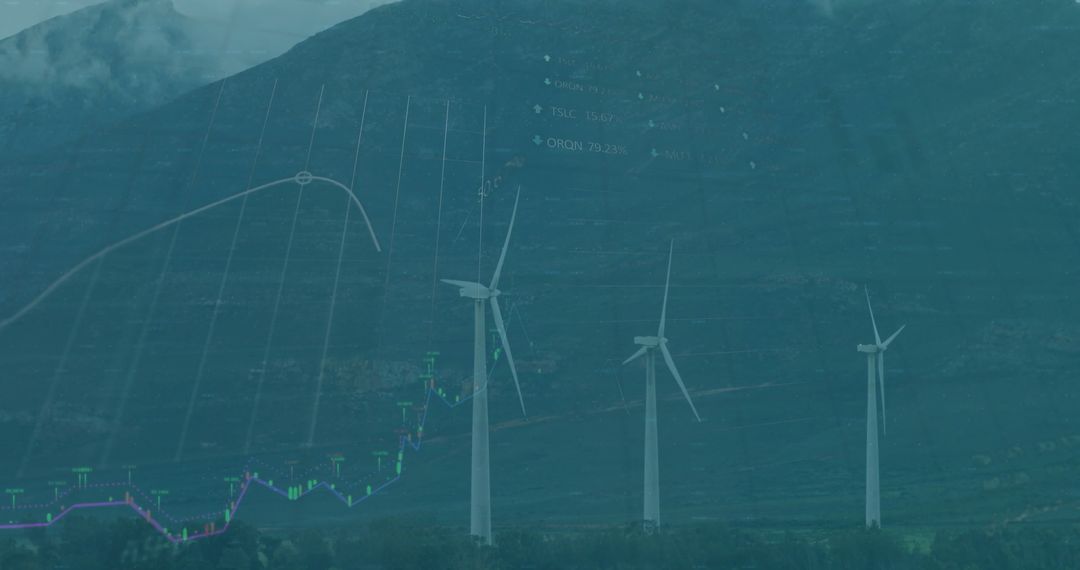
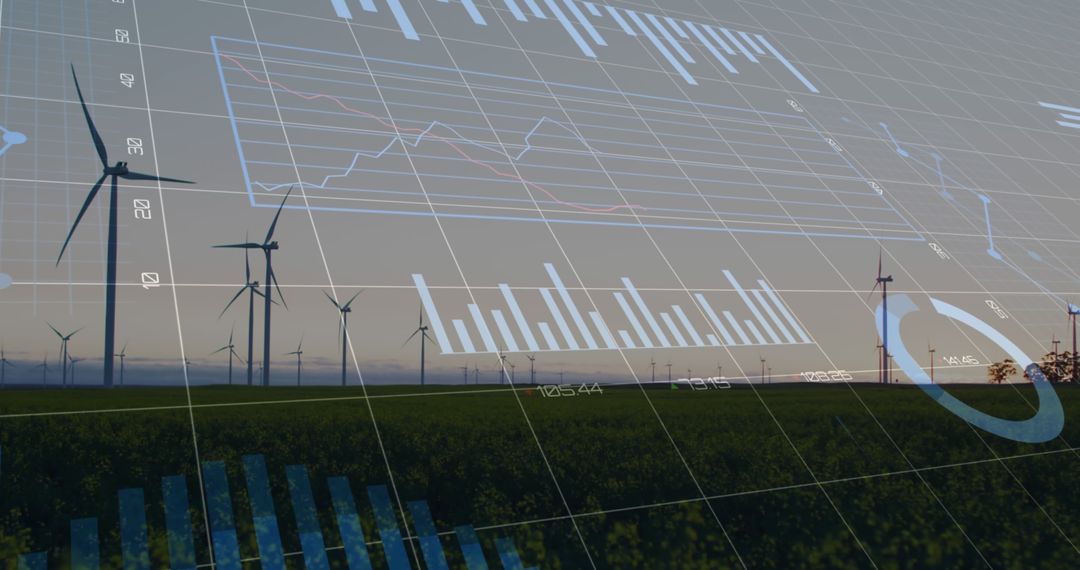
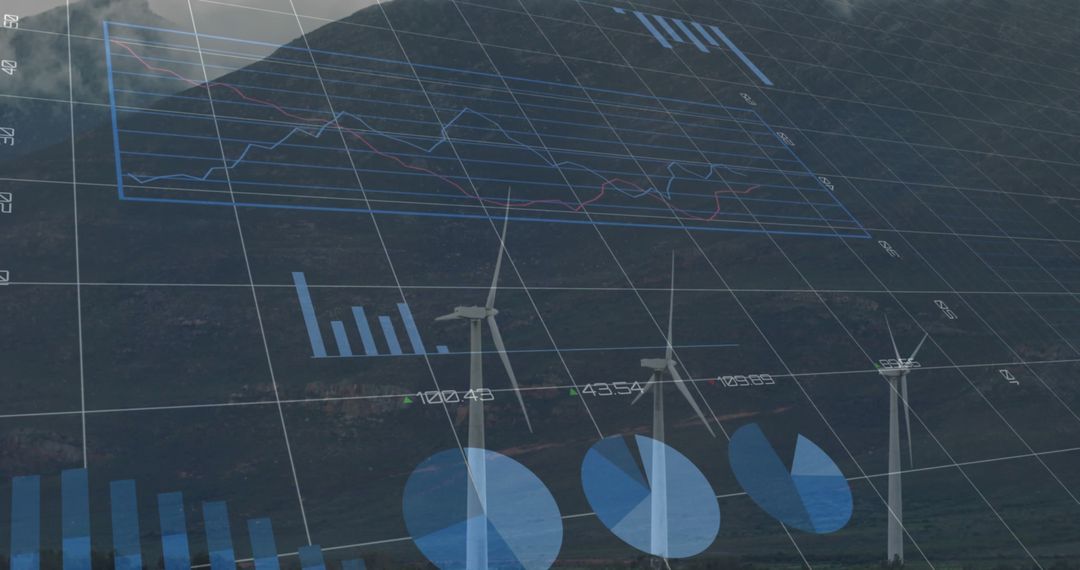
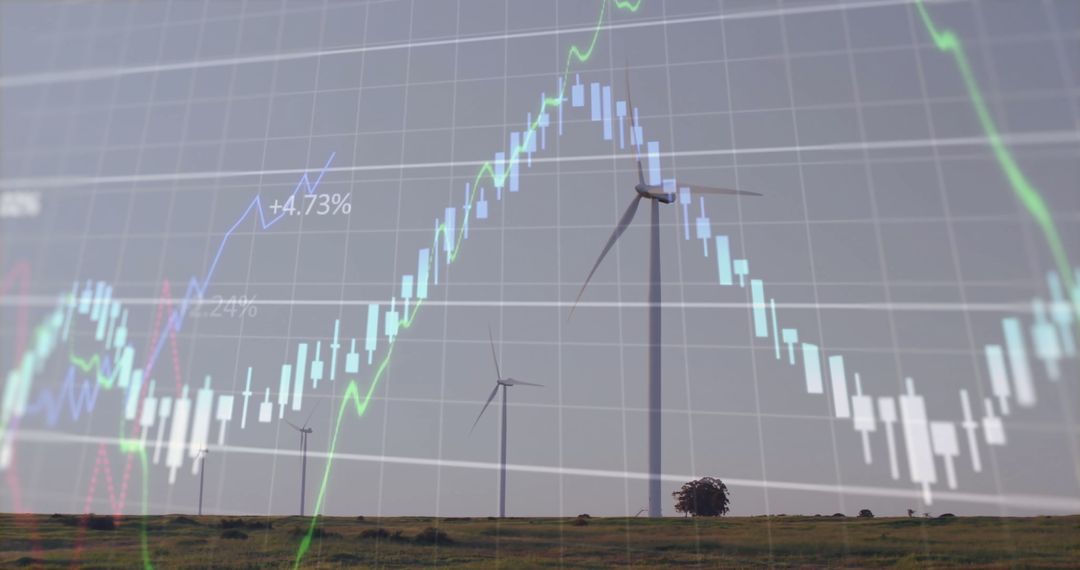
- Wind Farm Data Visualization with Colorful Line Graphs and Bar Charts on Mountain Landscape
Wind Farm Data Visualization with Colorful Line Graphs and Bar Charts on Mountain Landscape Image

Showing wind turbines on mountain grassland with translucent data overlay featuring colorful line graphs and vertical bar charts, conveying intersection of renewable energy and analytics. Using deep blue palette with yellow, red and green accent lines plus semi-transparent grid to highlight trends and key metrics while turbines remain visible in midground. Creating high-tech, data-driven mood suitable for editorial, corporate and marketing applications. Pairing well with headlines about wind power growth, energy market performance, sustainability goals, investment analysis or climate policy. Working well as header for corporate sustainability report, slide deck cover for investor presentation, website hero for energy company, infographic background for social channels or editorial illustration for news articles. Space available for overlaying logo, headline or numeric metrics.
Powered by  - Get 15% off with code: PIKWIZARD15


0
downloads
downloads
Tags:
More
Credit Photo
If you would like to credit the Photo, here are some ways you can do so
Text Link
photo Link
<span class="text-link">
<span>
<a target="_blank" href=https://pikwizard.com/photo/wind-farm-data-visualization-with-colorful-line-graphs-and-bar-charts-on-mountain-landscape/ab05b96a5bbd7bb9599252ad53b6c587/>PikWizard</a>
</span>
</span>
<span class="image-link">
<span
style="margin: 0 0 20px 0; display: inline-block; vertical-align: middle; width: 100%;"
>
<a
target="_blank"
href="https://pikwizard.com/photo/wind-farm-data-visualization-with-colorful-line-graphs-and-bar-charts-on-mountain-landscape/ab05b96a5bbd7bb9599252ad53b6c587/"
style="text-decoration: none; font-size: 10px; margin: 0;"
>
<img src="https://pikwizard.com/pw/medium/ab05b96a5bbd7bb9599252ad53b6c587.jpg" style="margin: 0; width: 100%;" alt="" />
<p style="font-size: 12px; margin: 0;">PikWizard</p>
</a>
</span>
</span>
Free (free of charge)
Free for personal and commercial use.
Author: People Creations
Similar Free Stock Images

Premium


Premium


Premium


Premium


Premium


Premium


Premium


Premium


Premium


Premium


Premium


Premium


Premium


Premium


Premium


Premium


Premium


Premium


Premium


Premium


Premium


Premium


Premium


Premium