
- Home >
- Stock Photos >
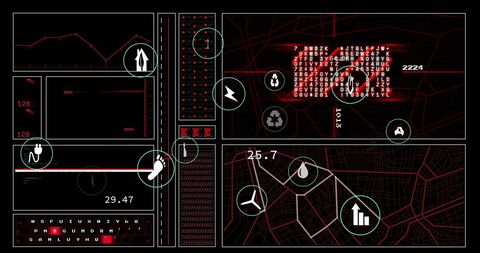
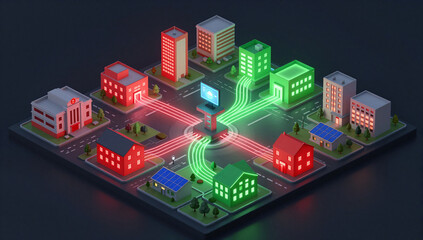
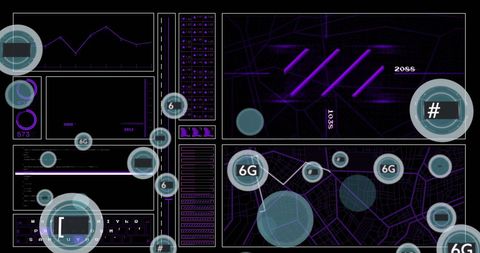
- Wireframe City Dashboard Visualizing Urban Data with Neon Analytics Interface
Wireframe City Dashboard Visualizing Urban Data with Neon Analytics Interface Image

Futuristic wireframe city presenting columnar data stream with neon teal icons representing CO2, energy, recycling, transport and power. High-contrast red wireframe buildings over black background creating cyberpunk tech atmosphere and clear visual hierarchy for data points. Ideal for use across tech presentations, smart city reports, IoT dashboards, sustainability briefings, urban planning visualizations, product landing pages, and website hero banners. Design tips: retaining full-width horizontal crop to preserve skyline and data columns; placing overlay text in upper or lower margins to avoid obscuring central icons; pairing with bold sans-serif fonts and teal/red accent palette for cohesive branding. Licensing recommendations: serving editorial and commercial creative campaigns, pitch decks, whitepapers, and social media ads.
Powered by 


downloads
Tags:
More
Credit Photo
If you would like to credit the Photo, here are some ways you can do so
Text Link
photo Link
<span class="text-link">
<span>
<a target="_blank" href=https://pikwizard.com/photo/wireframe-city-dashboard-visualizing-urban-data-with-neon-analytics-interface/463c66353b69bc42f5e00422e2b58c70/>PikWizard</a>
</span>
</span>
<span class="image-link">
<span
style="margin: 0 0 20px 0; display: inline-block; vertical-align: middle; width: 100%;"
>
<a
target="_blank"
href="https://pikwizard.com/photo/wireframe-city-dashboard-visualizing-urban-data-with-neon-analytics-interface/463c66353b69bc42f5e00422e2b58c70/"
style="text-decoration: none; font-size: 10px; margin: 0;"
>
<img src="https://pikwizard.com/pw/medium/463c66353b69bc42f5e00422e2b58c70.jpg" style="margin: 0; width: 100%;" alt="" />
<p style="font-size: 12px; margin: 0;">PikWizard</p>
</a>
</span>
</span>
Free (free of charge)
Free for personal and commercial use.
Author: Authentic Images
Similar Free Stock Images
Premium


Premium


Premium


Premium


Premium


Premium


Premium


Premium

Premium


Premium


Premium


Premium


Premium


Premium

Premium


Premium


Premium

Premium


Premium


Premium


Premium

Premium


Premium


Premium


Premium


Explore More Free Stock Images