- Home >
- Stock Photos >
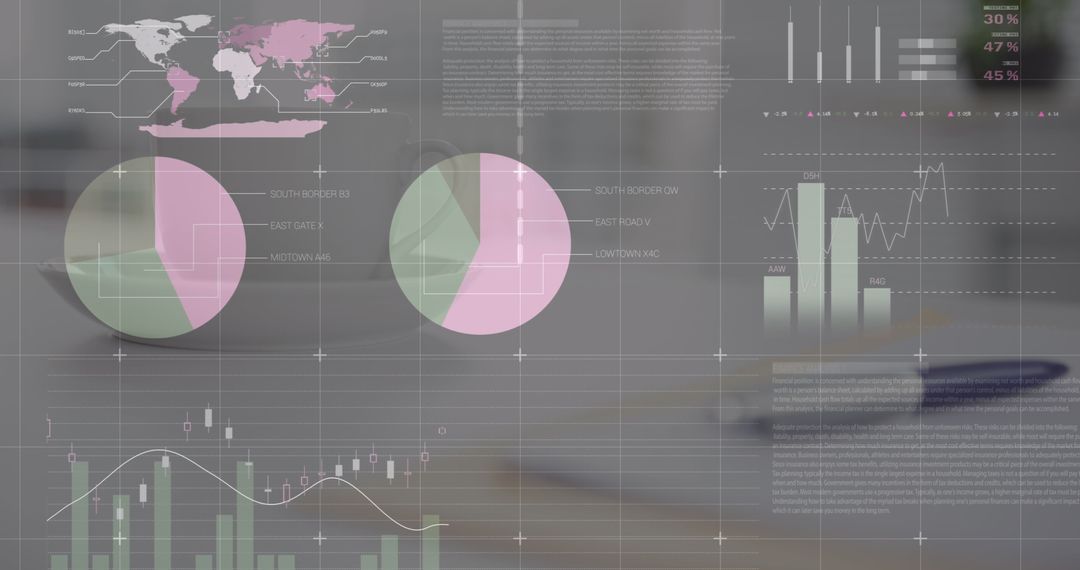
- Woman Analyzing Business Graphs with Digital Interface Overlay
Woman Analyzing Business Graphs with Digital Interface Overlay Image

This visual depicts a woman writing on a planner surrounded by statistical graphs overlay. Useful for illustrating concepts of data analysis, technology-driven business environments, innovative financial strategies, and the role of professional women in data-centric fields. Perfect for websites, presentations, and marketing materials focusing on trends and insights.
Powered by  - Get 15% off with code: PIKWIZARD15


2
downloads
downloads
Tags:
More
Credit Photo
If you would like to credit the Photo, here are some ways you can do so
Text Link
photo Link
<span class="text-link">
<span>
<a target="_blank" href=https://pikwizard.com/photo/woman-analyzing-business-graphs-with-digital-interface-overlay/c25282f2b94b68bea6f75930f7a685e1/>PikWizard</a>
</span>
</span>
<span class="image-link">
<span
style="margin: 0 0 20px 0; display: inline-block; vertical-align: middle; width: 100%;"
>
<a
target="_blank"
href="https://pikwizard.com/photo/woman-analyzing-business-graphs-with-digital-interface-overlay/c25282f2b94b68bea6f75930f7a685e1/"
style="text-decoration: none; font-size: 10px; margin: 0;"
>
<img src="https://pikwizard.com/pw/medium/c25282f2b94b68bea6f75930f7a685e1.jpg" style="margin: 0; width: 100%;" alt="" />
<p style="font-size: 12px; margin: 0;">PikWizard</p>
</a>
</span>
</span>
Free (free of charge)
Free for personal and commercial use.
Author: People Creations
Similar Free Stock Images

Premium


Premium


Premium


Premium


Premium


Premium


Premium


Premium


Premium


Premium


Premium


Premium


Premium


Premium


Premium


Premium


Premium


Premium


Premium


Premium


Premium


Premium


Premium


Premium