
- Home >
- Stock Photos >
- World Map Analytics and Charts with Technology Dashboard Display
World Map Analytics and Charts with Technology Dashboard Display Image
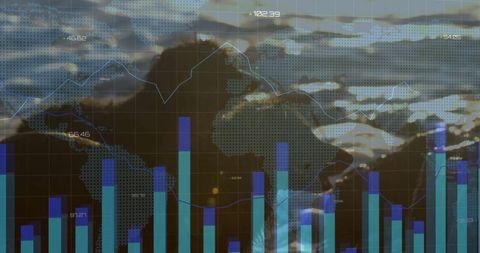
Visualization of data through charts on world map enhances understanding of analytics. Ideal for use in presentations regarding global business scenarios and financial overviews. Useful for technology, finance, and education materials aiming to demonstrate data trends strategically.
Powered by  - Get 15% off with code: PIKWIZARD15


0
downloads
downloads
Tags:
More
Credit Photo
If you would like to credit the Photo, here are some ways you can do so
Text Link
photo Link
<span class="text-link">
<span>
<a target="_blank" href=https://pikwizard.com/photo/world-map-analytics-and-charts-with-technology-dashboard-display/7a8680bd853b4dbc0672c3e0d24a1011/>PikWizard</a>
</span>
</span>
<span class="image-link">
<span
style="margin: 0 0 20px 0; display: inline-block; vertical-align: middle; width: 100%;"
>
<a
target="_blank"
href="https://pikwizard.com/photo/world-map-analytics-and-charts-with-technology-dashboard-display/7a8680bd853b4dbc0672c3e0d24a1011/"
style="text-decoration: none; font-size: 10px; margin: 0;"
>
<img src="https://pikwizard.com/pw/medium/7a8680bd853b4dbc0672c3e0d24a1011.jpg" style="margin: 0; width: 100%;" alt="" />
<p style="font-size: 12px; margin: 0;">PikWizard</p>
</a>
</span>
</span>
Free (free of charge)
Free for personal and commercial use.
Author: People Creations