
- Home >
- Stock Photos >
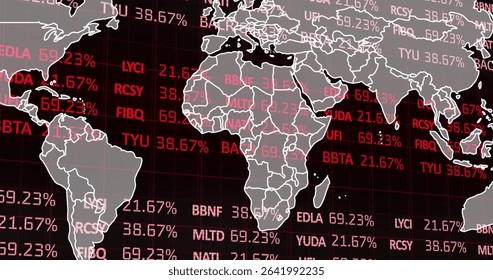
- World Map Display with Dynamic Financial Data Overlay
World Map Display with Dynamic Financial Data Overlay Image

Geopolitical illustration overlays digital visualization of global financial data, colorful stock numbers floating to display fluctuating market stats across continents representing world economy interconnectivity. Useful for presentations on global finance, business reports, data analysis, economic trends, market strategies, and worldwide economic discussions embedding insightful tech-and-data-based challenges or solutions.
Powered by  - Get 15% off with code: PIKWIZARD15


downloads
Tags:
More
Credit Photo
If you would like to credit the Photo, here are some ways you can do so
Text Link
photo Link
<span class="text-link">
<span>
<a target="_blank" href=https://pikwizard.com/photo/world-map-display-with-dynamic-financial-data-overlay/1b8783331e050b014c76f0cffec4c73a/>PikWizard</a>
</span>
</span>
<span class="image-link">
<span
style="margin: 0 0 20px 0; display: inline-block; vertical-align: middle; width: 100%;"
>
<a
target="_blank"
href="https://pikwizard.com/photo/world-map-display-with-dynamic-financial-data-overlay/1b8783331e050b014c76f0cffec4c73a/"
style="text-decoration: none; font-size: 10px; margin: 0;"
>
<img src="https://pikwizard.com/pw/medium/1b8783331e050b014c76f0cffec4c73a.jpg" style="margin: 0; width: 100%;" alt="" />
<p style="font-size: 12px; margin: 0;">PikWizard</p>
</a>
</span>
</span>
Free (free of charge)
Free for personal and commercial use.
Author: Awesome Content
Similar Free Stock Images

Premium


Premium


Premium


Premium


Premium


Premium

Premium

Premium


Premium


Premium


Premium

Premium


Premium


Premium


Premium


Premium


Premium


Premium

Premium


Premium


Premium


Premium


Premium


Premium


Premium

Explore More Free Stock Images