
- Home >
- Stock Photos >
- World Map Global Finance Data Analytics Visualization
World Map Global Finance Data Analytics Visualization Image
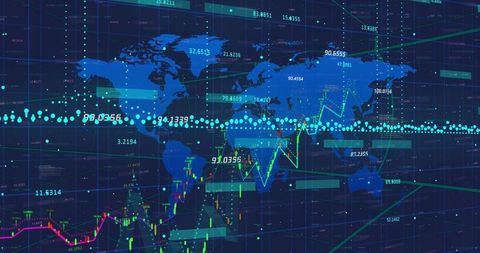
This visualization depicting financial trends overlaying a map of the world is ideal for use in presentations related to global finance, data analytics, or economics. It is perfect for illustrating complex concepts in digital finance and networking industries. The image conveys a sense of modern technology and broad connectivity.
Powered by 


downloads
Tags:
More
Credit Photo
If you would like to credit the Photo, here are some ways you can do so
Text Link
photo Link
<span class="text-link">
<span>
<a target="_blank" href=https://pikwizard.com/photo/world-map-global-finance-data-analytics-visualization/ad9d0a3a73925d564c4705dd06d466a3/>PikWizard</a>
</span>
</span>
<span class="image-link">
<span
style="margin: 0 0 20px 0; display: inline-block; vertical-align: middle; width: 100%;"
>
<a
target="_blank"
href="https://pikwizard.com/photo/world-map-global-finance-data-analytics-visualization/ad9d0a3a73925d564c4705dd06d466a3/"
style="text-decoration: none; font-size: 10px; margin: 0;"
>
<img src="https://pikwizard.com/pw/medium/ad9d0a3a73925d564c4705dd06d466a3.jpg" style="margin: 0; width: 100%;" alt="" />
<p style="font-size: 12px; margin: 0;">PikWizard</p>
</a>
</span>
</span>
Free (free of charge)
Free for personal and commercial use.
Author: Creative Art