- Home >
- Stock Photos >
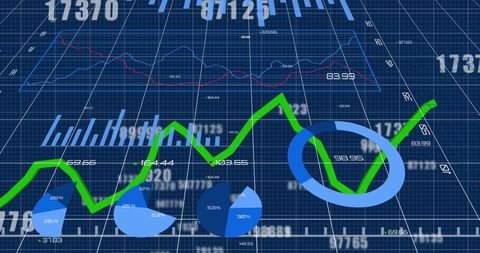
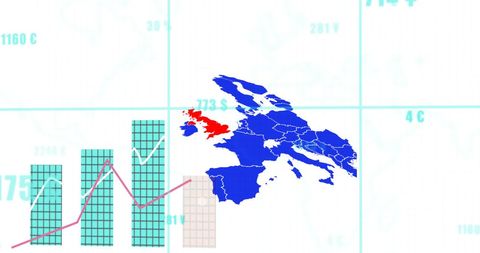
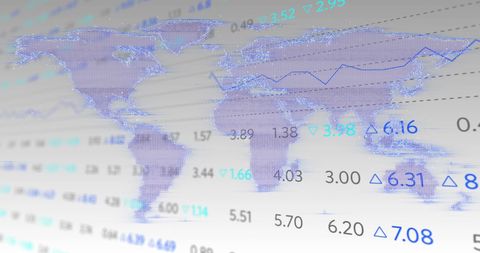
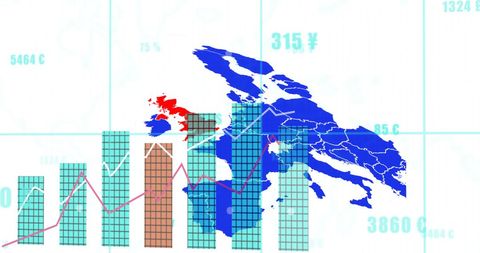
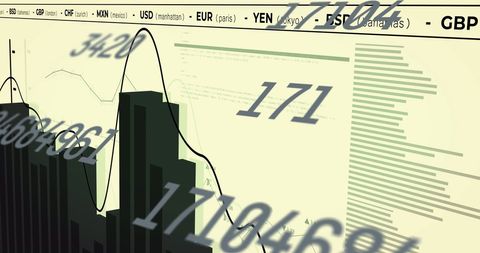
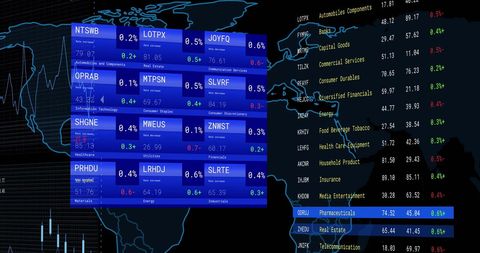
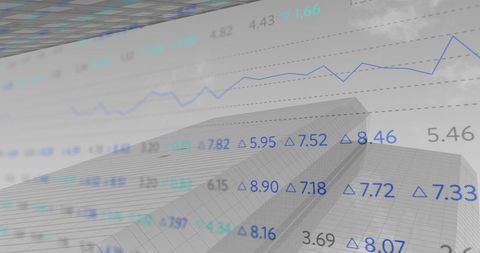
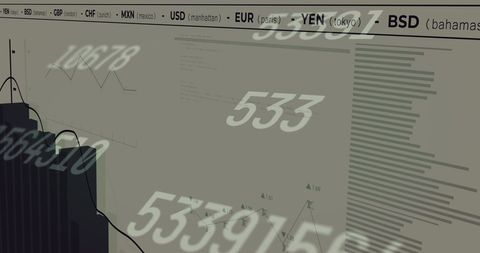
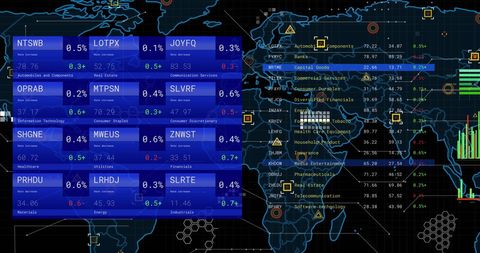
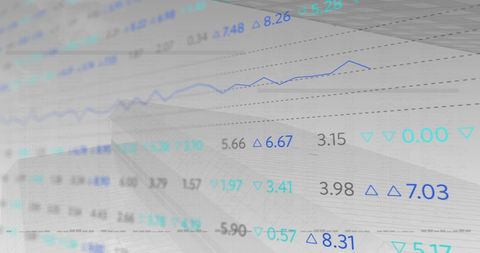
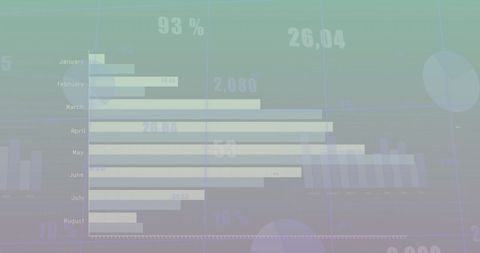
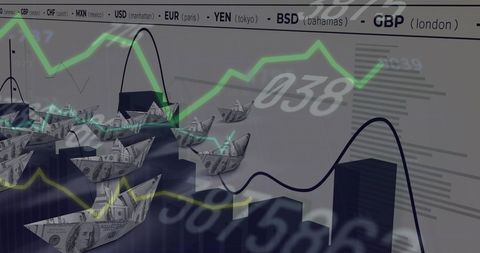
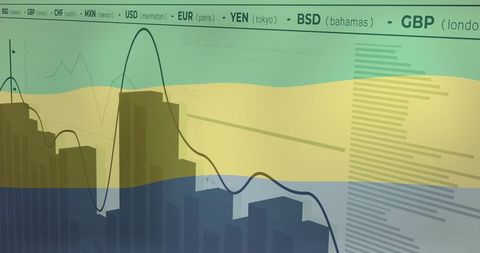
- World Map Overlay with Data Processing for Business Analytics
World Map Overlay with Data Processing for Business Analytics Image
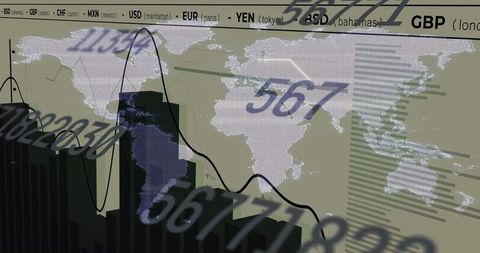
Illustration shows world map with overlay of data and numerical figures, symbolizing global business and digital interface. Useful for representing international markets, financial trading, stock market analysis, economic trends, and currency exchange rate displays, ideal for business reports, financial apps, and marketing materials.

downloads
Tags:
More
Credit Photo
If you would like to credit the Photo, here are some ways you can do so
Text Link
photo Link
<span class="text-link">
<span>
<a target="_blank" href=https://pikwizard.com/photo/world-map-overlay-with-data-processing-for-business-analytics/409f928138da96b89edd708488b021bd/>PikWizard</a>
</span>
</span>
<span class="image-link">
<span
style="margin: 0 0 20px 0; display: inline-block; vertical-align: middle; width: 100%;"
>
<a
target="_blank"
href="https://pikwizard.com/photo/world-map-overlay-with-data-processing-for-business-analytics/409f928138da96b89edd708488b021bd/"
style="text-decoration: none; font-size: 10px; margin: 0;"
>
<img src="https://pikwizard.com/pw/medium/409f928138da96b89edd708488b021bd.jpg" style="margin: 0; width: 100%;" alt="" />
<p style="font-size: 12px; margin: 0;">PikWizard</p>
</a>
</span>
</span>
Free (free of charge)
Free for personal and commercial use.
Author: People Creations