
- Home >
- Stock Photos >
- World Map Visualization with Bitcoin and Market Data Analytics
World Map Visualization with Bitcoin and Market Data Analytics Image

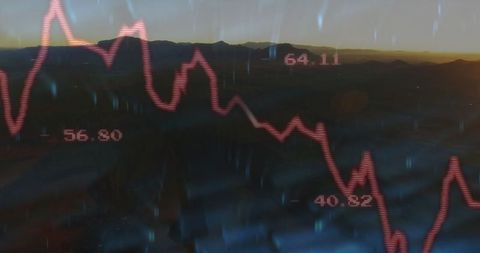
Image displays red jagged line representing market fluctuations over layered world map with Bitcoin symbols, signifying global impact of cryptocurrency on international markets. Used in contexts related to financial news, investment articles, tech blogs, and educational materials on cryptocurrency world trends.
Powered by 


downloads
Tags:
More
Credit Photo
If you would like to credit the Photo, here are some ways you can do so
Text Link
photo Link
<span class="text-link">
<span>
<a target="_blank" href=https://pikwizard.com/photo/world-map-visualization-with-bitcoin-and-market-data-analytics/d6f8a5ae46ecb39294aa3572ef6cce80/>PikWizard</a>
</span>
</span>
<span class="image-link">
<span
style="margin: 0 0 20px 0; display: inline-block; vertical-align: middle; width: 100%;"
>
<a
target="_blank"
href="https://pikwizard.com/photo/world-map-visualization-with-bitcoin-and-market-data-analytics/d6f8a5ae46ecb39294aa3572ef6cce80/"
style="text-decoration: none; font-size: 10px; margin: 0;"
>
<img src="https://pikwizard.com/pw/medium/d6f8a5ae46ecb39294aa3572ef6cce80.jpg" style="margin: 0; width: 100%;" alt="" />
<p style="font-size: 12px; margin: 0;">PikWizard</p>
</a>
</span>
</span>
Free (free of charge)
Free for personal and commercial use.
Author: People Creations
Similar Free Stock Images

Premium


Premium

Premium


Premium


Premium


Premium

Premium


Premium


Premium

Premium

Premium


Premium

Premium


Premium


Premium


Premium


Premium


Premium


Premium

Premium


Premium

Premium

AI


Premium


Premium


Premium

Explore More Free Stock Images