- Home >
- Stock Photos >
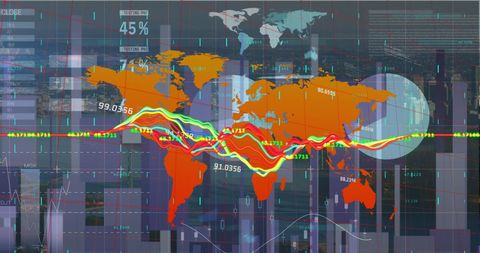
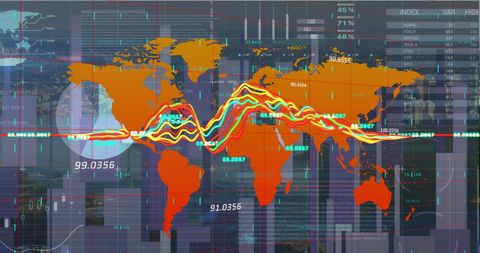
- World Map with Flowing Data Streams on Digital Screen
World Map with Flowing Data Streams on Digital Screen Image

Abstract visual depicting a world map overlaid by flowing colorful data waveforms and grid lines, presenting a contemporary form of data monitoring on a digital console. White linear graphs accentuate global data trends. Ideal for illustrations in tech blogs, articles on data science, presentations about global analytics, and digital marketing materials focused on technology and innovation.

downloads
Tags:
More
Credit Photo
If you would like to credit the Photo, here are some ways you can do so
Text Link
photo Link
<span class="text-link">
<span>
<a target="_blank" href=https://pikwizard.com/photo/world-map-with-flowing-data-streams-on-digital-screen/64fb653f4091cbde543d5d0493602a10/>PikWizard</a>
</span>
</span>
<span class="image-link">
<span
style="margin: 0 0 20px 0; display: inline-block; vertical-align: middle; width: 100%;"
>
<a
target="_blank"
href="https://pikwizard.com/photo/world-map-with-flowing-data-streams-on-digital-screen/64fb653f4091cbde543d5d0493602a10/"
style="text-decoration: none; font-size: 10px; margin: 0;"
>
<img src="https://pikwizard.com/pw/medium/64fb653f4091cbde543d5d0493602a10.jpg" style="margin: 0; width: 100%;" alt="" />
<p style="font-size: 12px; margin: 0;">PikWizard</p>
</a>
</span>
</span>
Free (free of charge)
Free for personal and commercial use.
Author: Creative Art