- Home >
- Stock Photos >
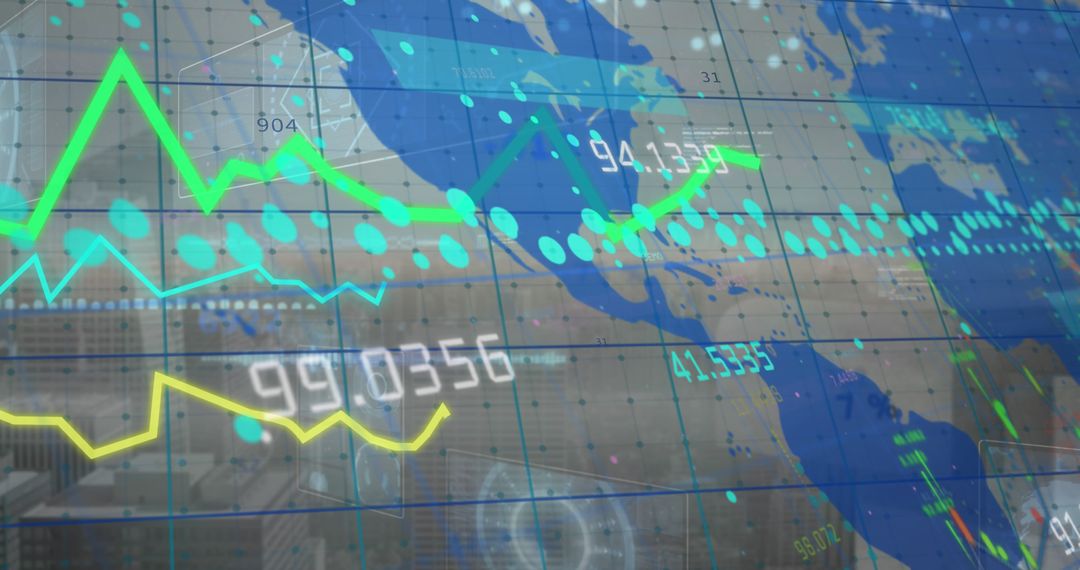
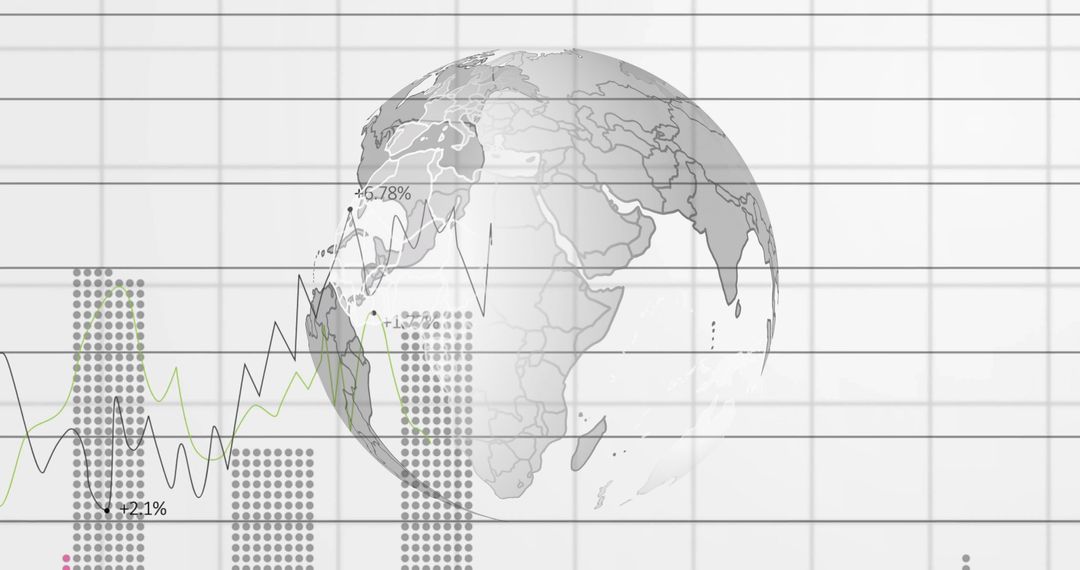
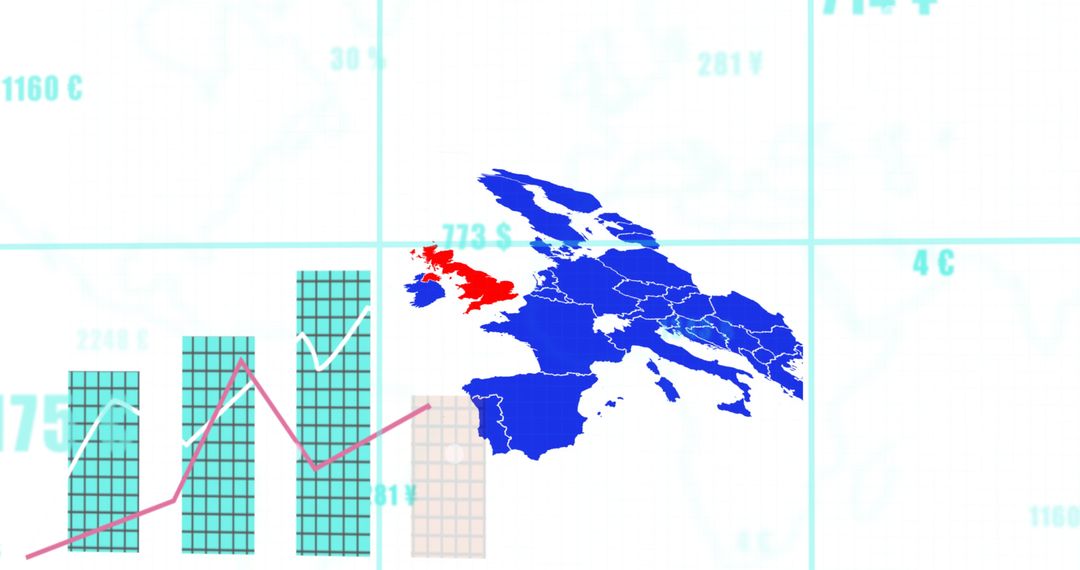
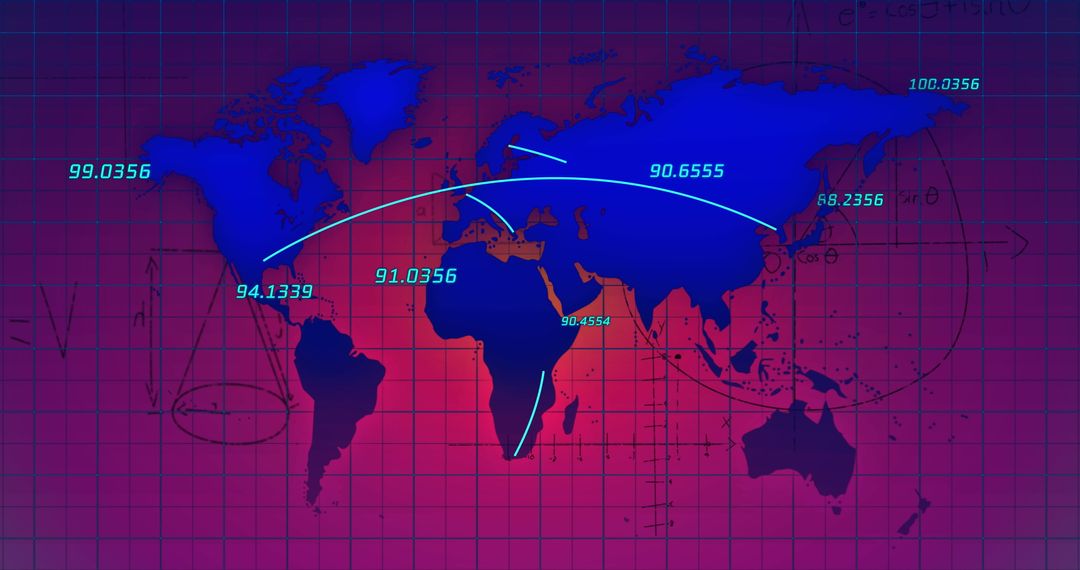
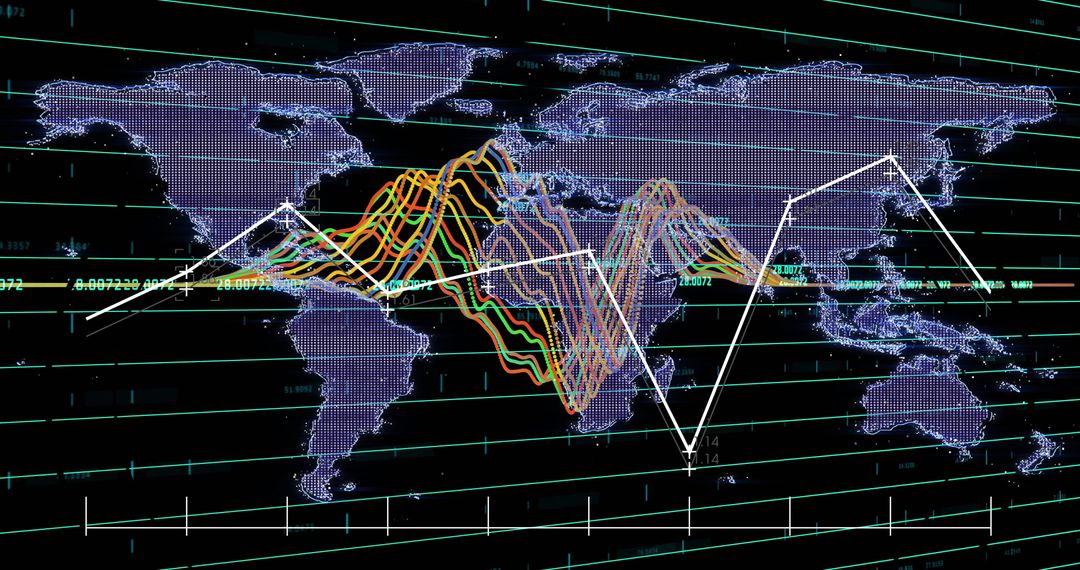
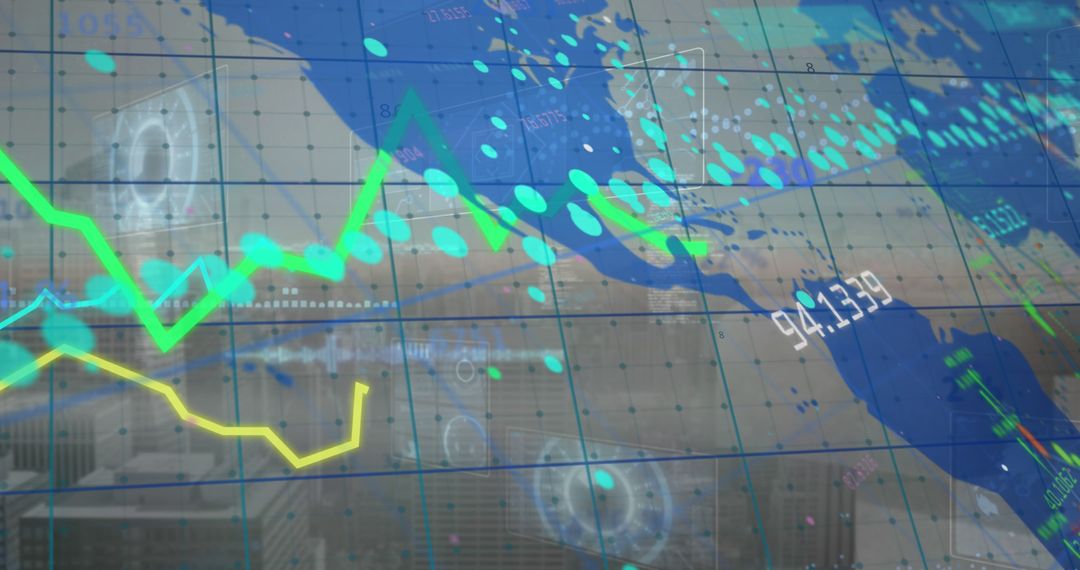
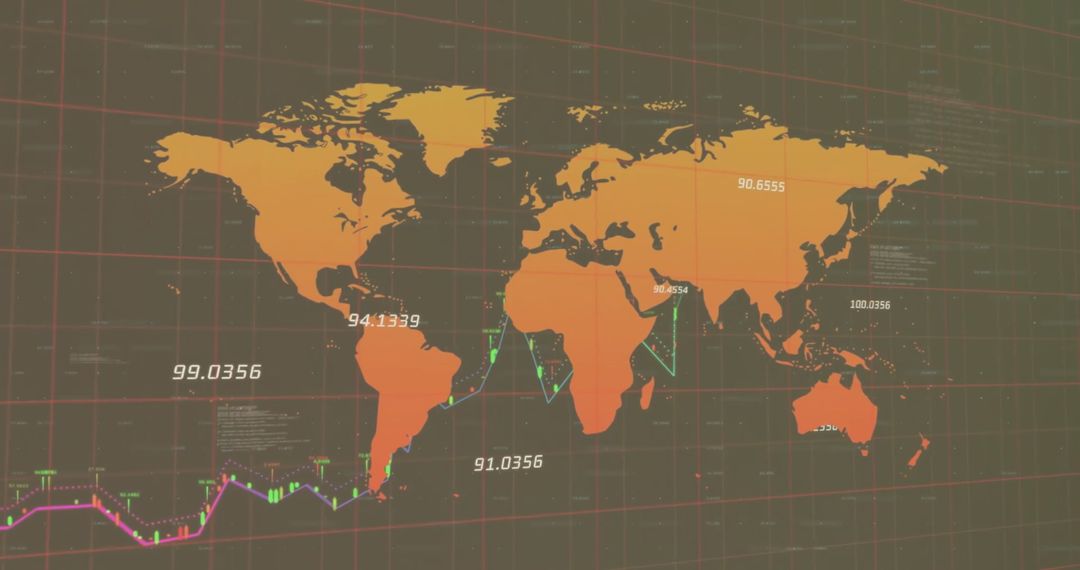
- World Map with Green and Yellow Trend Lines on Digital Dashboard
World Map with Green and Yellow Trend Lines on Digital Dashboard Image

The image shows a world map with vibrant green and yellow trend lines, set against digital elements like percentage symbols. This depiction is useful for topics related to global economics, financial analytics, and data visualization. Perfect for illustrating articles, presentations, and reports on global markets, technology, and international analysis trends.
Powered by  - Get 15% off with code: PIKWIZARD15


0
downloads
downloads
Tags:
More
Credit Photo
If you would like to credit the Photo, here are some ways you can do so
Text Link
photo Link
<span class="text-link">
<span>
<a target="_blank" href=https://pikwizard.com/photo/world-map-with-green-and-yellow-trend-lines-on-digital-dashboard/61167cb066b92345fa9eed6db6fe3553/>PikWizard</a>
</span>
</span>
<span class="image-link">
<span
style="margin: 0 0 20px 0; display: inline-block; vertical-align: middle; width: 100%;"
>
<a
target="_blank"
href="https://pikwizard.com/photo/world-map-with-green-and-yellow-trend-lines-on-digital-dashboard/61167cb066b92345fa9eed6db6fe3553/"
style="text-decoration: none; font-size: 10px; margin: 0;"
>
<img src="https://pikwizard.com/pw/medium/61167cb066b92345fa9eed6db6fe3553.jpg" style="margin: 0; width: 100%;" alt="" />
<p style="font-size: 12px; margin: 0;">PikWizard</p>
</a>
</span>
</span>
Free (free of charge)
Free for personal and commercial use.
Author: Authentic Images
Similar Free Stock Images

Premium


Premium


Premium


Premium


Premium


Premium


Premium


Premium


Premium


Premium


Premium


Premium


Premium


Premium


Premium


Premium


Premium


Premium


Premium


Premium


Premium


Premium


Premium


Premium