- Home >
- Stock Photos >
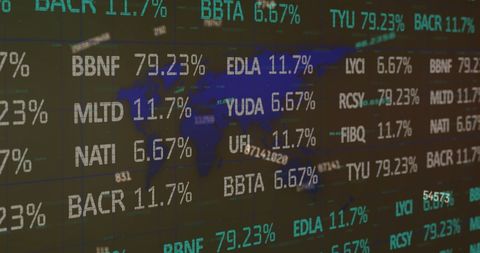
- World Map with Stock Market Data and Statistical Analysis
World Map with Stock Market Data and Statistical Analysis Image

Visual representation of stock market data processing with overlaying charts and world map highlighting global financial concepts. Useful for illustrating international business connections, trends in economics, or global investment strategies. Can be used in presentations, reports, and articles related to financial forecasting and market analysis.

downloads
Tags:
More
Credit Photo
If you would like to credit the Photo, here are some ways you can do so
Text Link
photo Link
<span class="text-link">
<span>
<a target="_blank" href=https://pikwizard.com/photo/world-map-with-stock-market-data-and-statistical-analysis/a1369718fd0450df5dfd0b9c25d0470f/>PikWizard</a>
</span>
</span>
<span class="image-link">
<span
style="margin: 0 0 20px 0; display: inline-block; vertical-align: middle; width: 100%;"
>
<a
target="_blank"
href="https://pikwizard.com/photo/world-map-with-stock-market-data-and-statistical-analysis/a1369718fd0450df5dfd0b9c25d0470f/"
style="text-decoration: none; font-size: 10px; margin: 0;"
>
<img src="https://pikwizard.com/pw/medium/a1369718fd0450df5dfd0b9c25d0470f.jpg" style="margin: 0; width: 100%;" alt="" />
<p style="font-size: 12px; margin: 0;">PikWizard</p>
</a>
</span>
</span>
Free (free of charge)
Free for personal and commercial use.
Author: People Creations