
- Home >
- Stock Photos >
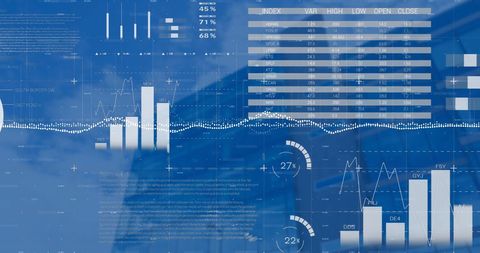
- Worldwide Data Analytics with Stock Limit Dashboard Visualization
Worldwide Data Analytics with Stock Limit Dashboard Visualization Image

Futuristic dashboard with global perspectives used in presentations, analytics, and technology articles emphasizing data visualization and global financial trends. Ideal for illustrating concepts of real-time data tracking and business intelligence systems.
Powered by 


downloads
Tags:
More
Credit Photo
If you would like to credit the Photo, here are some ways you can do so
Text Link
photo Link
<span class="text-link">
<span>
<a target="_blank" href=https://pikwizard.com/photo/worldwide-data-analytics-with-stock-limit-dashboard-visualization/7cbd475411d51e18023d7f1185fa0ccc/>PikWizard</a>
</span>
</span>
<span class="image-link">
<span
style="margin: 0 0 20px 0; display: inline-block; vertical-align: middle; width: 100%;"
>
<a
target="_blank"
href="https://pikwizard.com/photo/worldwide-data-analytics-with-stock-limit-dashboard-visualization/7cbd475411d51e18023d7f1185fa0ccc/"
style="text-decoration: none; font-size: 10px; margin: 0;"
>
<img src="https://pikwizard.com/pw/medium/7cbd475411d51e18023d7f1185fa0ccc.jpg" style="margin: 0; width: 100%;" alt="" />
<p style="font-size: 12px; margin: 0;">PikWizard</p>
</a>
</span>
</span>
Free (free of charge)
Free for personal and commercial use.
Author: People Creations
Similar Free Stock Images

Premium


Premium


Premium


Premium


Premium


Premium


Premium


Premium


Premium


Premium


Premium


Premium


Premium


Premium

Premium


Premium

Premium


Premium

Premium


Premium


Premium


Premium

Premium


Premium


Premium


Explore More Free Stock Images