
- Home >
- Stock Photos >
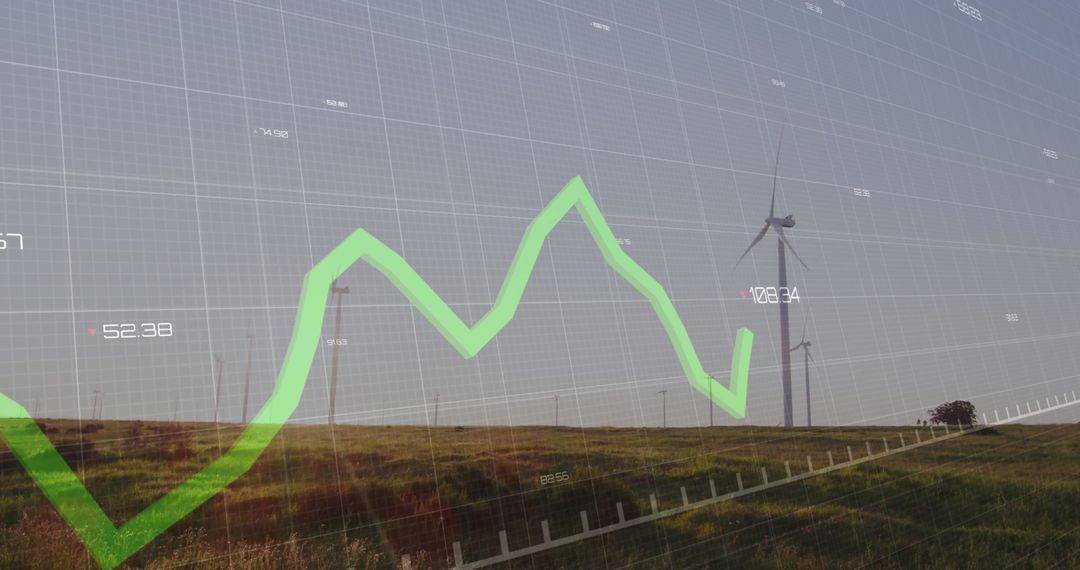
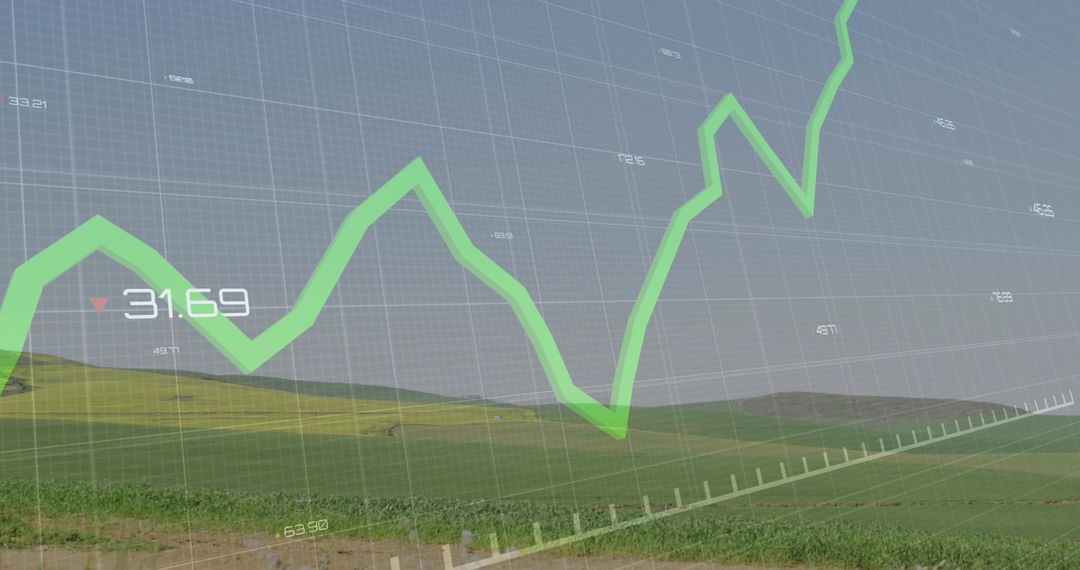
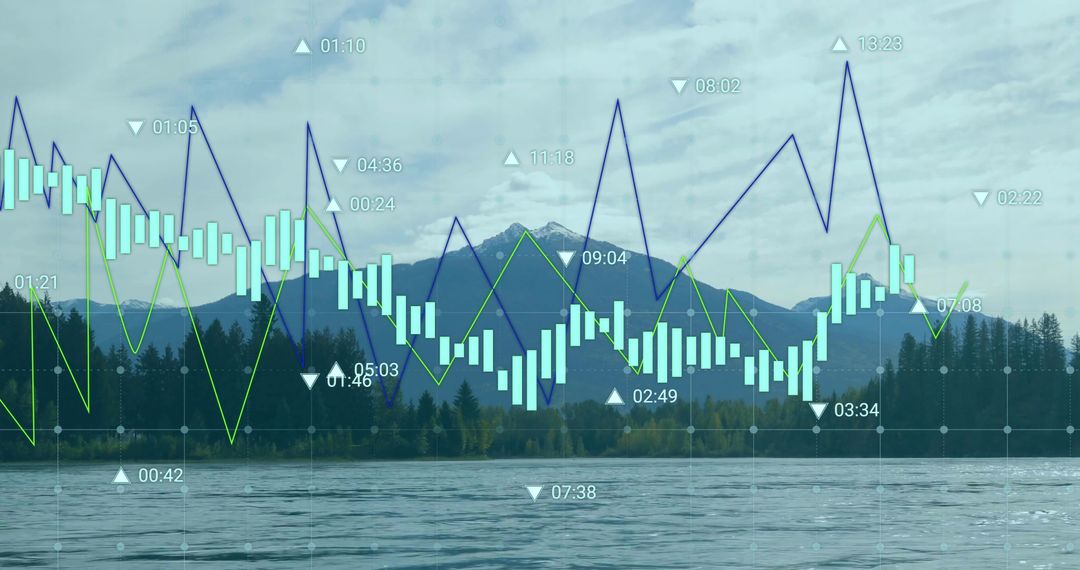
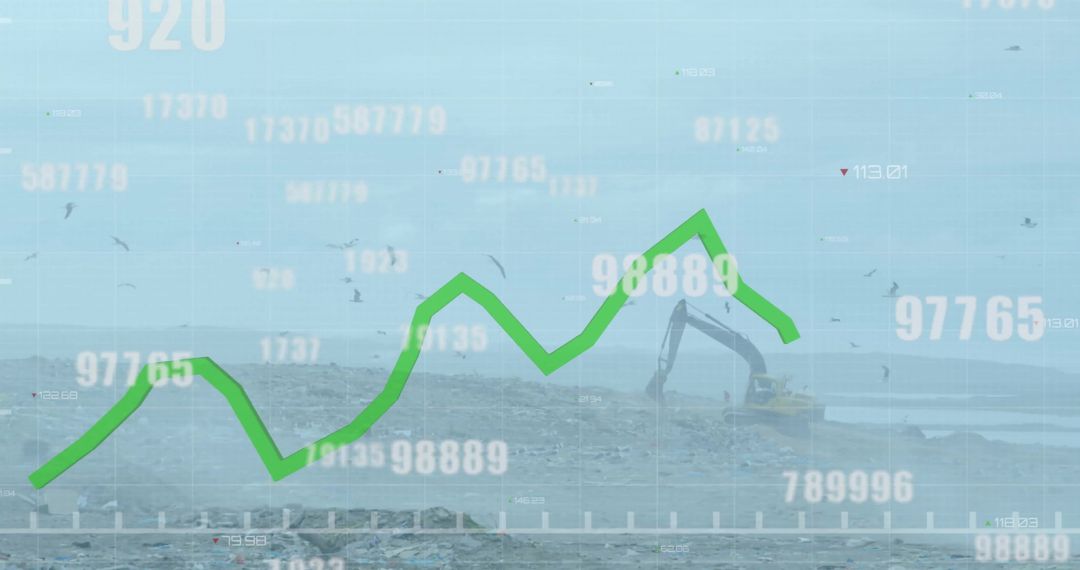
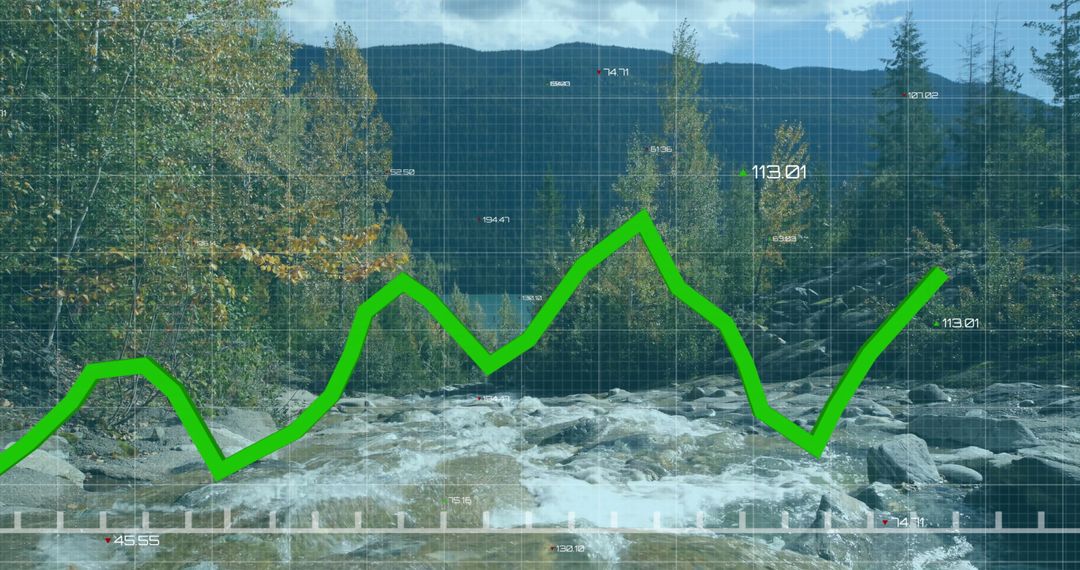
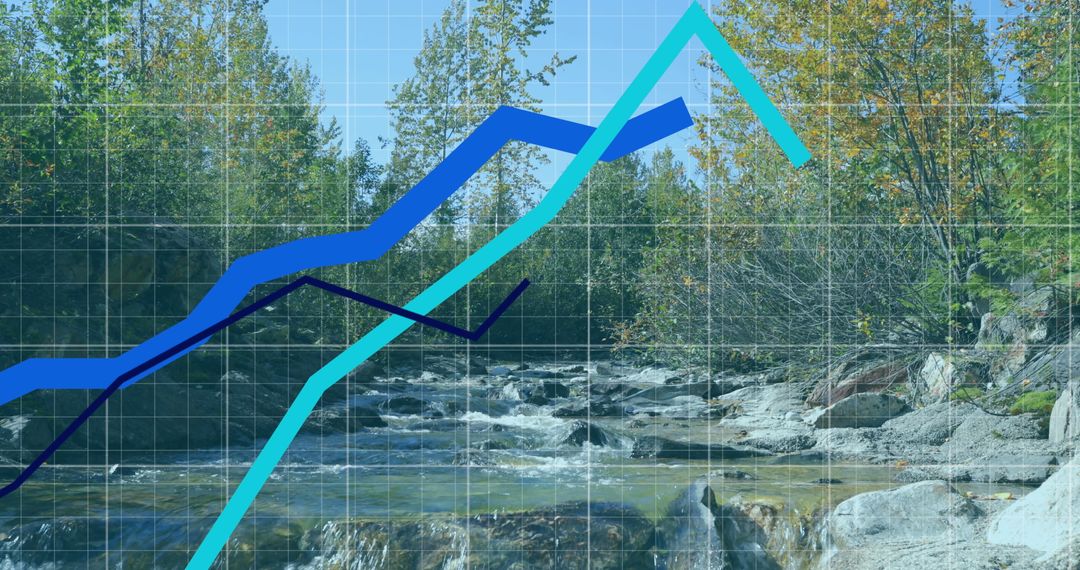
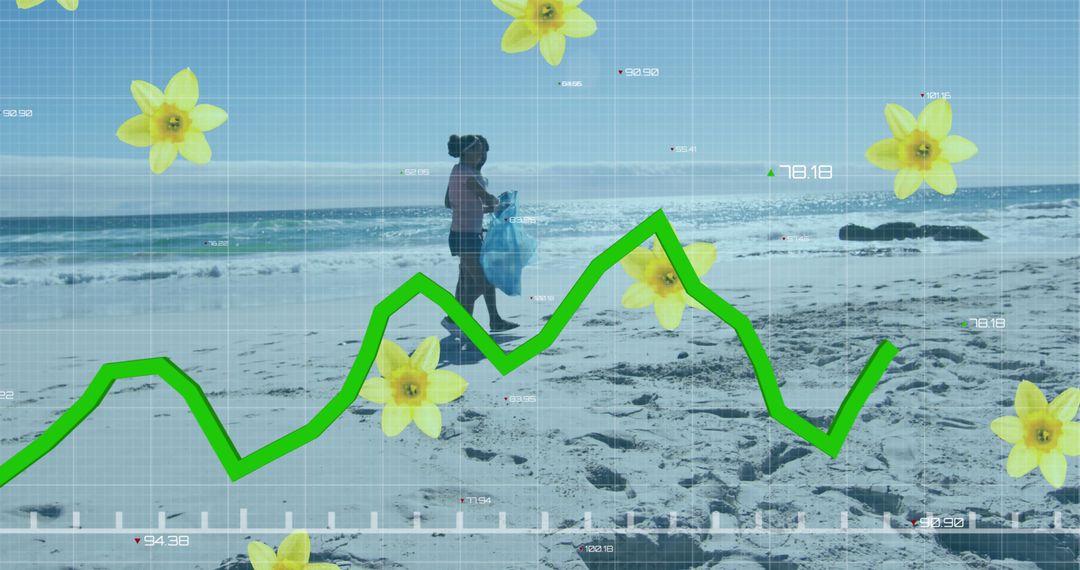
- Zigzag Line Graph Overlaying Serene Lake and Forest Landscape
Zigzag Line Graph Overlaying Serene Lake and Forest Landscape Image
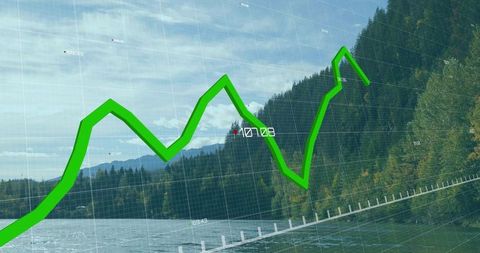
Green line graph zigzagging across translucent grid, set against serene lake view and lush forest. Perfect for combining concepts of data analysis with natural harmony. Ideal for presentations on environmental analytics, financial growth with emphasis on sustainability, or eco-friendly technology solutions.
Powered by 


0
downloads
downloads
Tags:
More
Credit Photo
If you would like to credit the Photo, here are some ways you can do so
Text Link
photo Link
<span class="text-link">
<span>
<a target="_blank" href=https://pikwizard.com/photo/zigzag-line-graph-overlaying-serene-lake-and-forest-landscape/4ae9c0337cc38cbf5099256f930d9faa/>PikWizard</a>
</span>
</span>
<span class="image-link">
<span
style="margin: 0 0 20px 0; display: inline-block; vertical-align: middle; width: 100%;"
>
<a
target="_blank"
href="https://pikwizard.com/photo/zigzag-line-graph-overlaying-serene-lake-and-forest-landscape/4ae9c0337cc38cbf5099256f930d9faa/"
style="text-decoration: none; font-size: 10px; margin: 0;"
>
<img src="https://pikwizard.com/pw/medium/4ae9c0337cc38cbf5099256f930d9faa.jpg" style="margin: 0; width: 100%;" alt="" />
<p style="font-size: 12px; margin: 0;">PikWizard</p>
</a>
</span>
</span>
Free (free of charge)
Free for personal and commercial use.
Author: People Creations
Similar Free Stock Images

Premium


Premium


Premium


Premium


Premium


Premium


Premium


Premium


Premium


Premium


Premium


Premium


Premium


Premium


Premium


Premium


Premium


Premium


Premium


Premium


Premium


Premium


Premium


Premium

