
- Home >
- Stock PNGs >
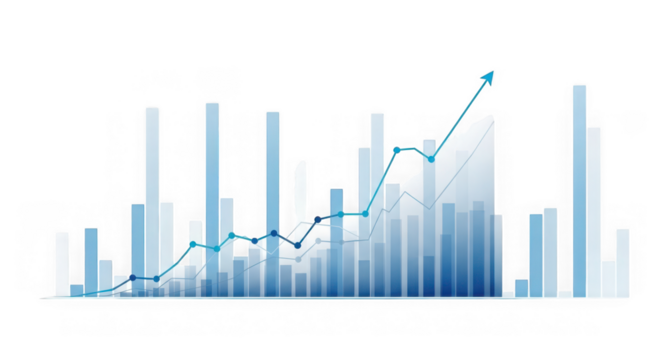
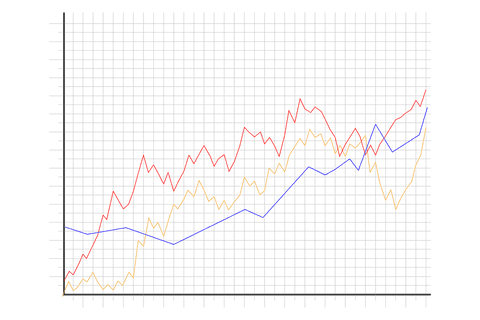
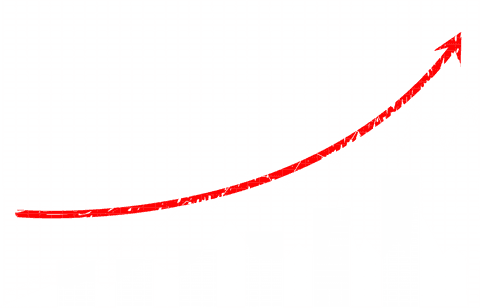
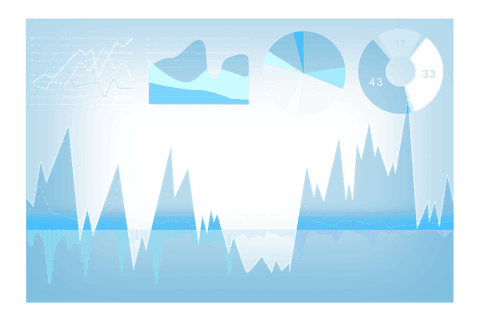
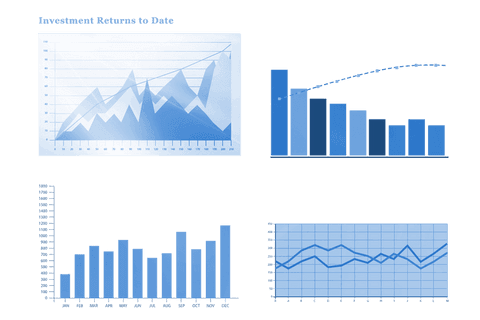
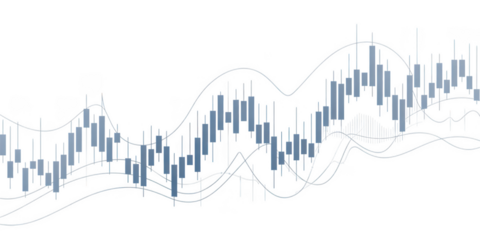
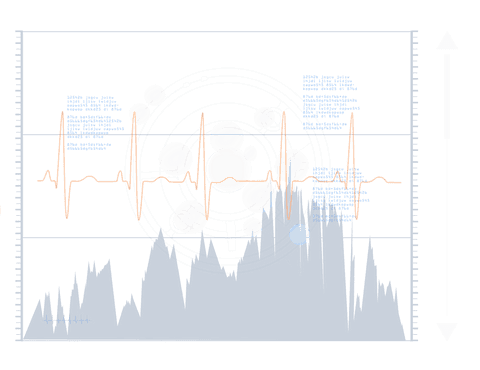
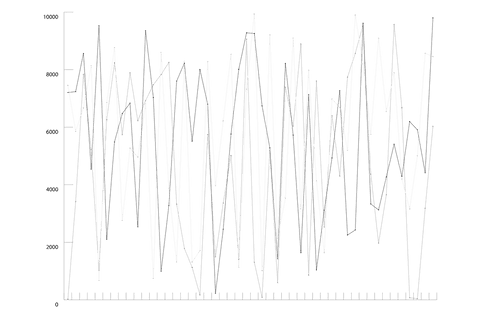
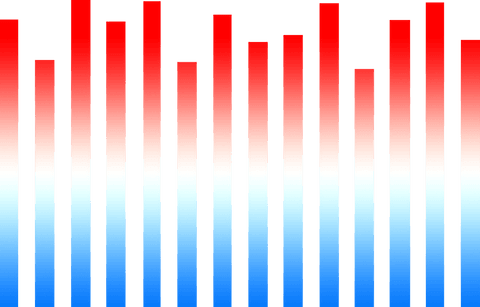
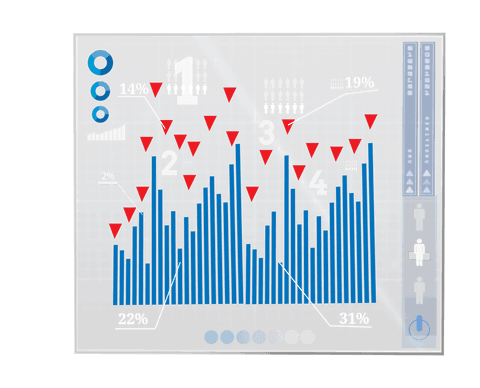
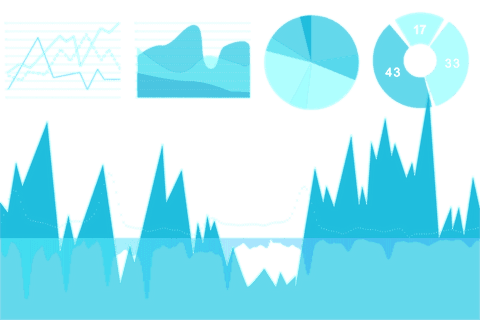
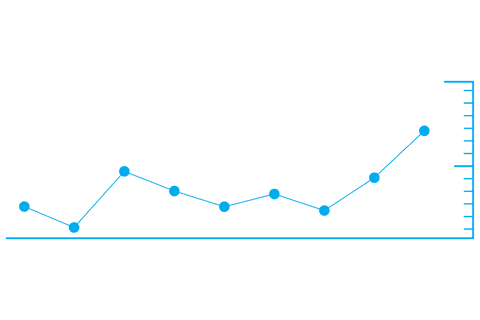
- Blue Chart Illustration on Transparent Background Economics Concept
Blue Chart Illustration on Transparent Background Economics Concept PNG
Bright blue graph illustrating concept of statistical changes, with spikes in value, enhances economic presentations. Completely isolated with transparent settings making virtual integration versatile, perfect for economic reports, educational diagrams, financial forecasts, business presentations & data analysis showcase.
Powered by 


downloads
Tags:
More
Credit Photo
If you would like to credit the Photo, here are some ways you can do so
Text Link
png Link
<span class="text-link">
<span>
<a target="_blank" href=https://pikwizard.com/png/blue-chart-illustration-on-transparent-background-economics-concept/2b2b82eb04a784d4c0dc25df408b7c55/>PikWizard</a>
</span>
</span>
<span class="image-link">
<span
style="margin: 0 0 20px 0; display: inline-block; vertical-align: middle; width: 100%;"
>
<a
target="_blank"
href="https://pikwizard.com/png/blue-chart-illustration-on-transparent-background-economics-concept/2b2b82eb04a784d4c0dc25df408b7c55/"
style="text-decoration: none; font-size: 10px; margin: 0;"
>
<img src="https://pikwizard.com/pw/medium/2b2b82eb04a784d4c0dc25df408b7c55.png" style="margin: 0; width: 100%;" alt="" />
<p style="font-size: 12px; margin: 0;">PikWizard</p>
</a>
</span>
</span>
Free (free of charge)
Free for personal and commercial use.
Author: Awesome Content
Similar Free PNG Images With Transparent Background


Premium


Premium


Premium


Premium


Premium


Premium


Premium


Premium


Premium

Premium


Premium


Premium


Premium


Premium

Premium


Premium


Premium


Premium


Premium


Premium

Premium


Premium


Premium


Premium


Premium


Explore More Free PNGs