
- Home >
- Stock PNGs >
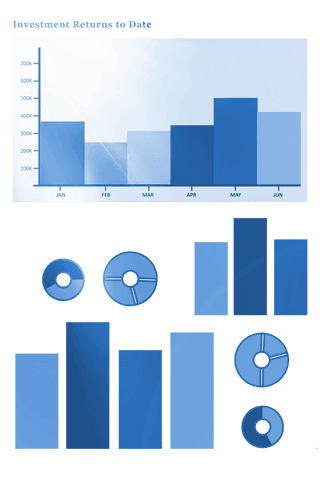
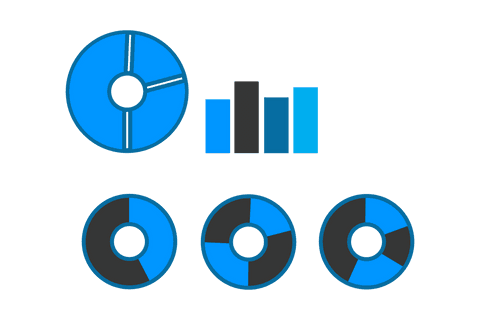
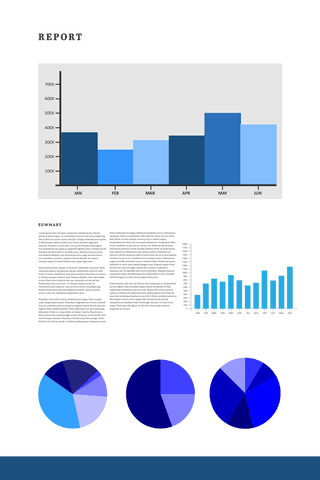
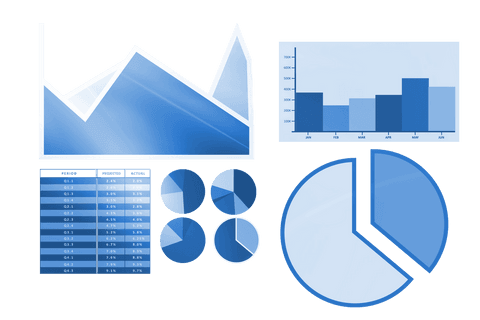
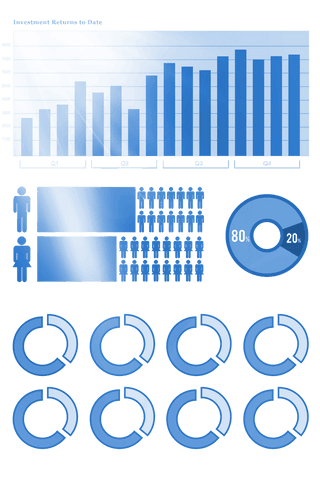
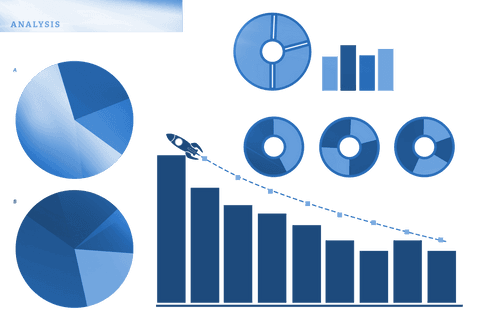
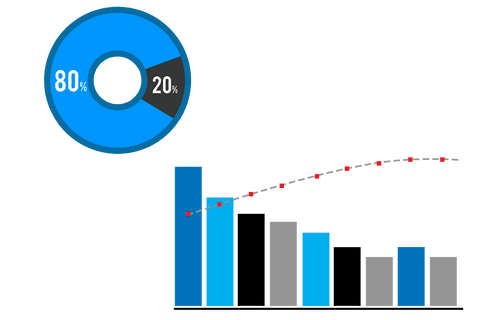
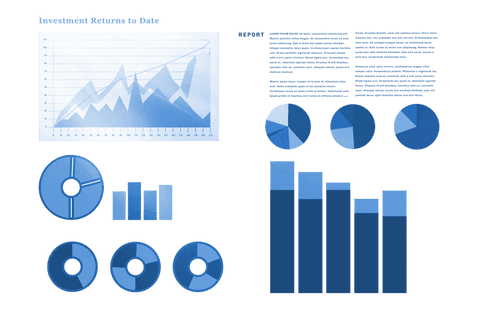
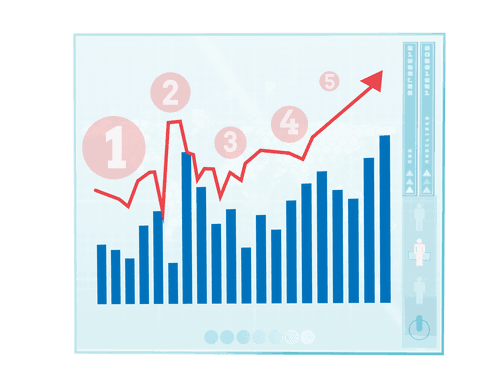
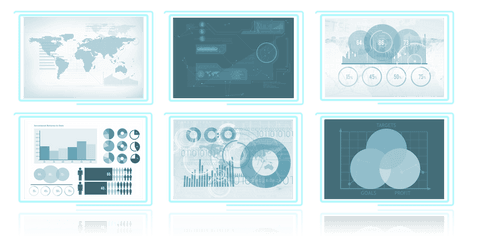
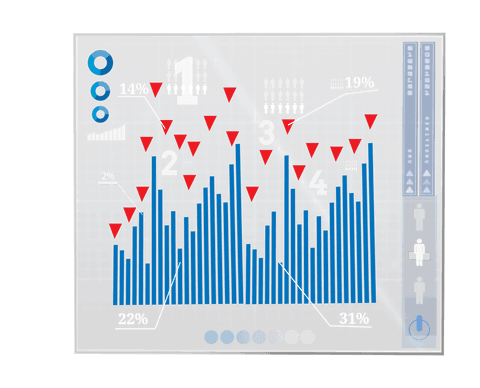
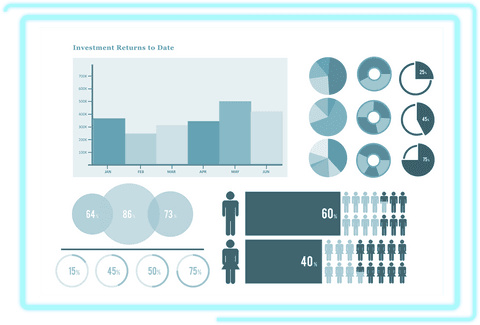
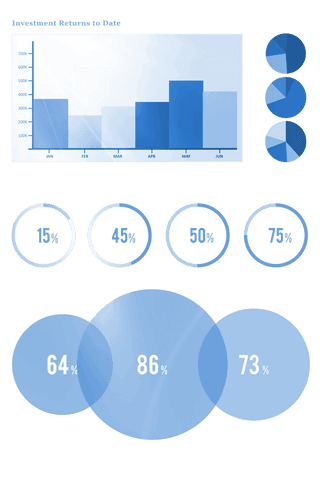
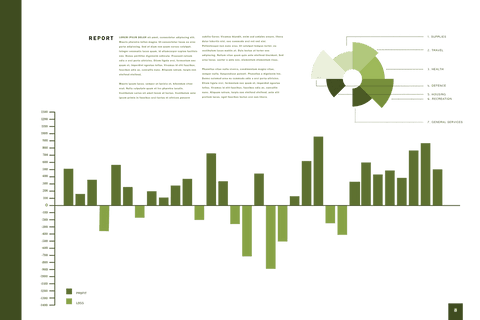
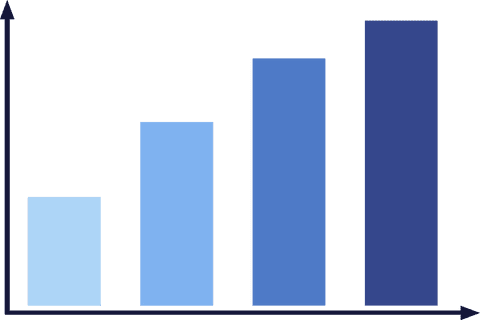
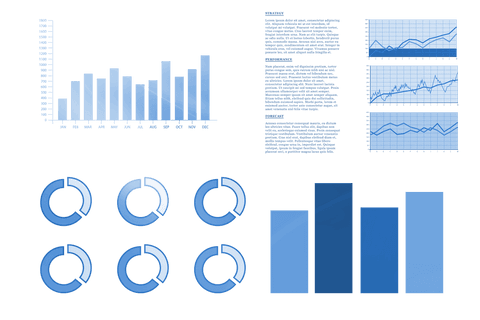
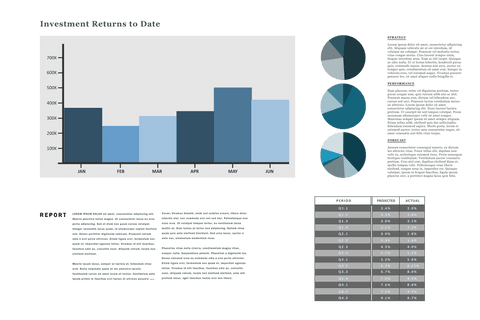
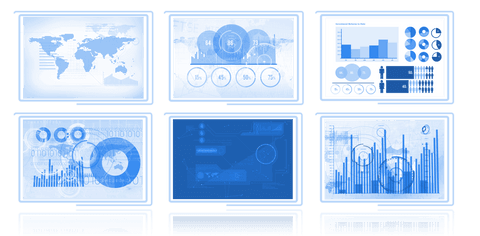
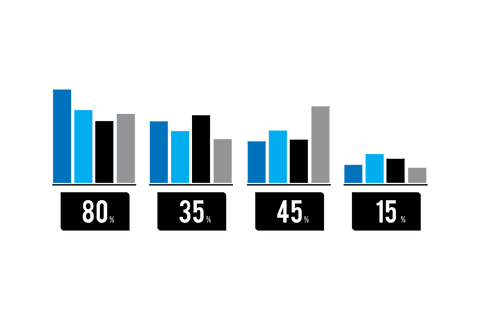
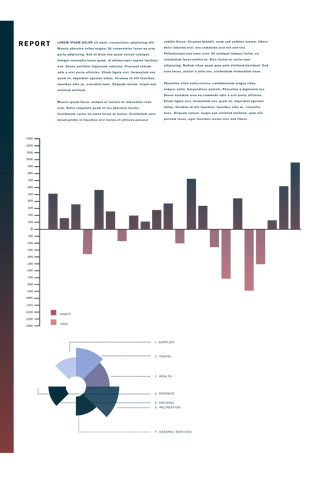
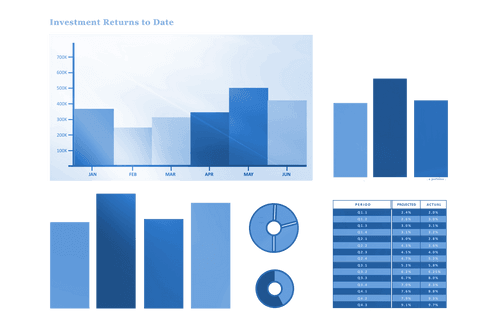
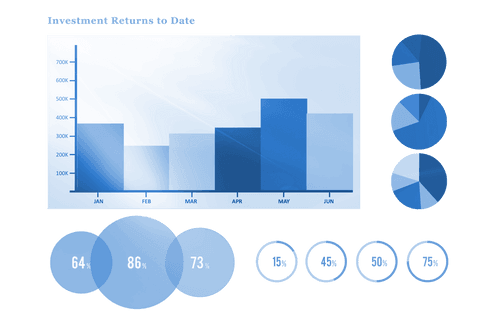
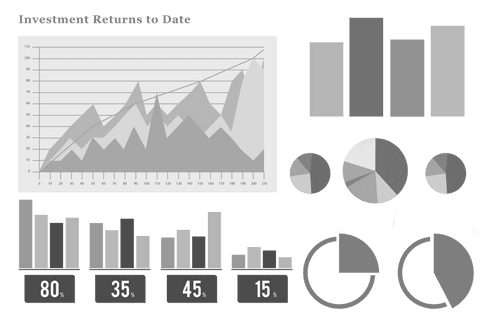
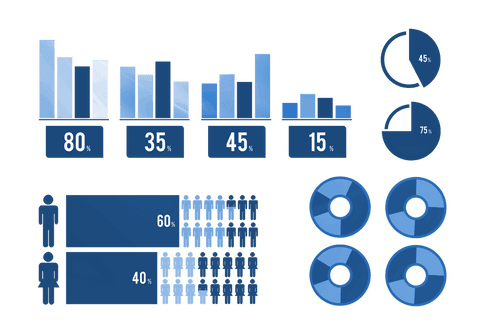
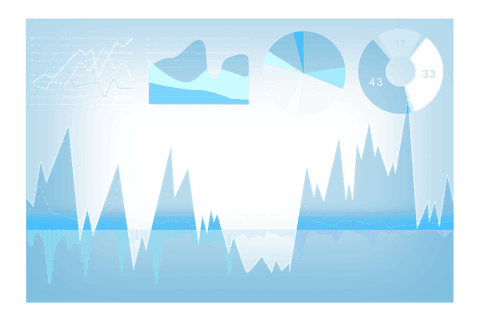
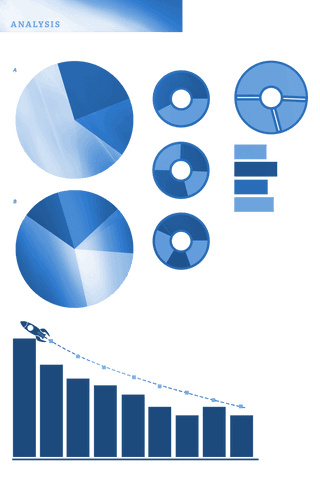
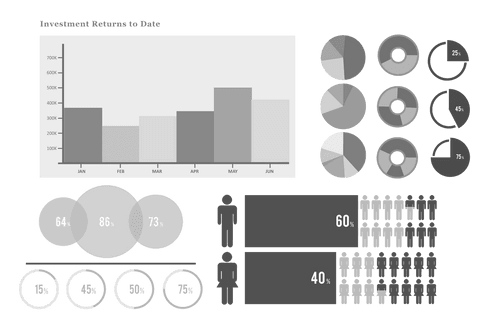
- Blue Statistic Comparison Jan-Jun on Transparent Background for Business Usage
Blue Statistic Comparison Jan-Jun on Transparent Background for Business Usage PNG
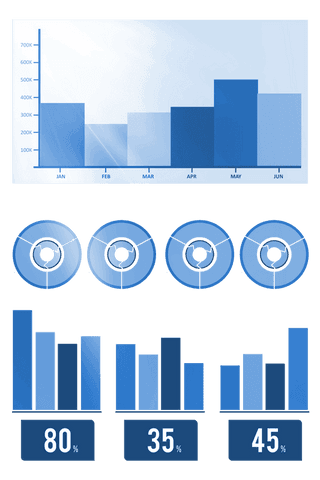
Digital illustration featuring multiple blue statistics charts on a transparent background includes bar and circular charts, ideal for business and finance presentations. Helpful for illustrating data comparisons over several months such as January to June in various formats, enhancing visual communication in report documents or digital platforms.
Powered by 


downloads
Tags:
More
Credit Photo
If you would like to credit the Photo, here are some ways you can do so
Text Link
png Link
<span class="text-link">
<span>
<a target="_blank" href=https://pikwizard.com/png/blue-statistic-comparison-jan-jun-on-transparent-background-for-business-usage/35b636ab4217f31f5a99cd53d6373abb/>PikWizard</a>
</span>
</span>
<span class="image-link">
<span
style="margin: 0 0 20px 0; display: inline-block; vertical-align: middle; width: 100%;"
>
<a
target="_blank"
href="https://pikwizard.com/png/blue-statistic-comparison-jan-jun-on-transparent-background-for-business-usage/35b636ab4217f31f5a99cd53d6373abb/"
style="text-decoration: none; font-size: 10px; margin: 0;"
>
<img src="https://pikwizard.com/pw/medium/35b636ab4217f31f5a99cd53d6373abb.png" style="margin: 0; width: 100%;" alt="" />
<p style="font-size: 12px; margin: 0;">PikWizard</p>
</a>
</span>
</span>
Free (free of charge)
Free for personal and commercial use.
Author: Creative Art
Similar Free PNG Images With Transparent Background
Loading...

Premium


Premium

Premium


Premium

Premium


Premium


Premium


Premium

Premium

Premium

Premium


Premium


Premium

Premium


Premium

Premium


Premium

Premium


Premium


Premium


Premium


Premium

Premium

Premium


Premium


Explore More Free PNGs