1. Home > 
  2. Stock PNGs > 
  3. Business Statistics Infographic with Transparent Background Overview

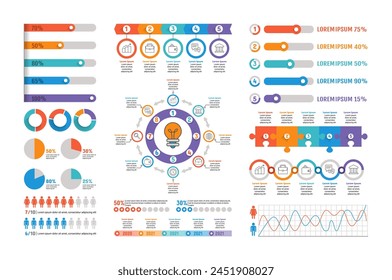
Business Statistics Infographic with Transparent Background Overview PNG

Business Statistics Infographic with Transparent Background Overview

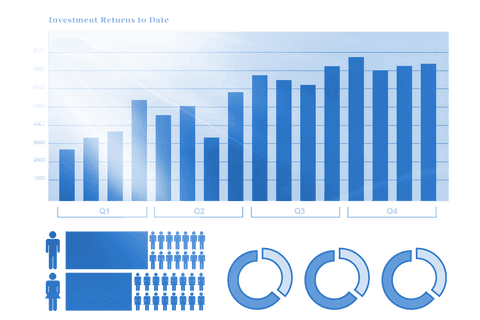
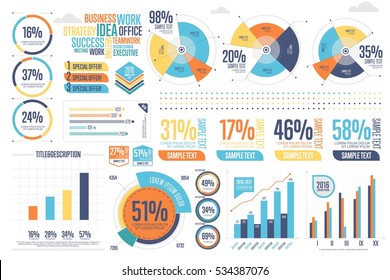
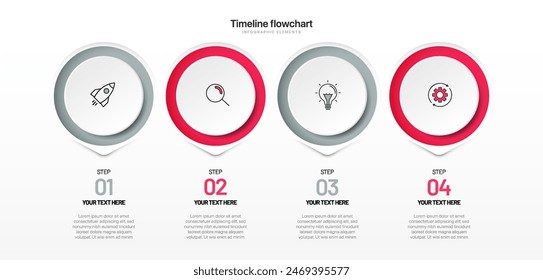
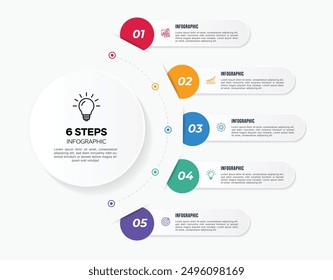
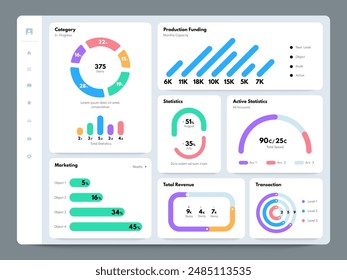
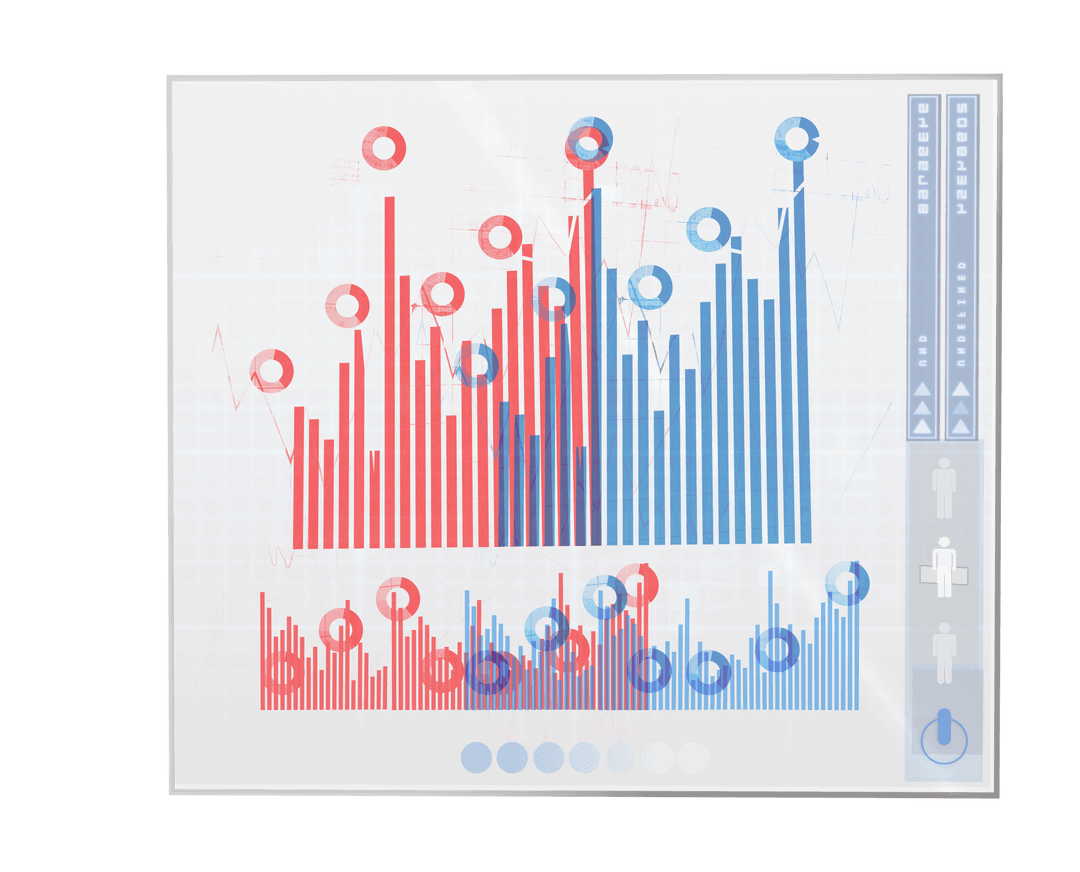
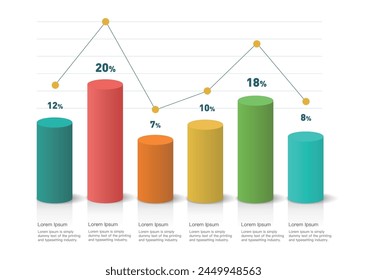
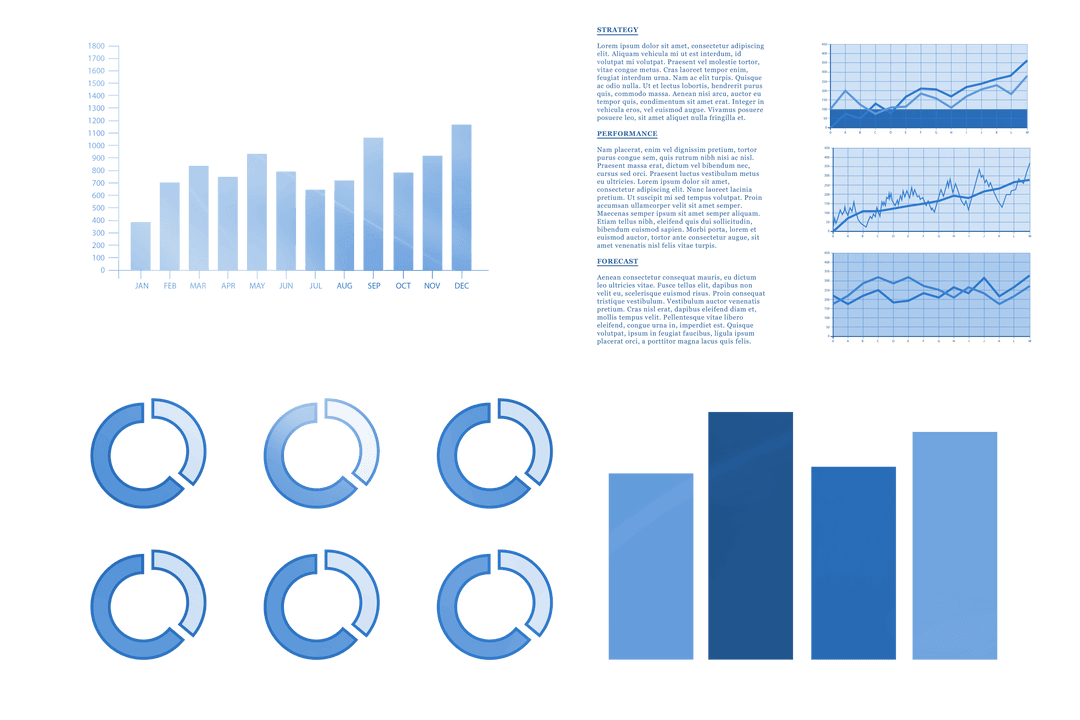
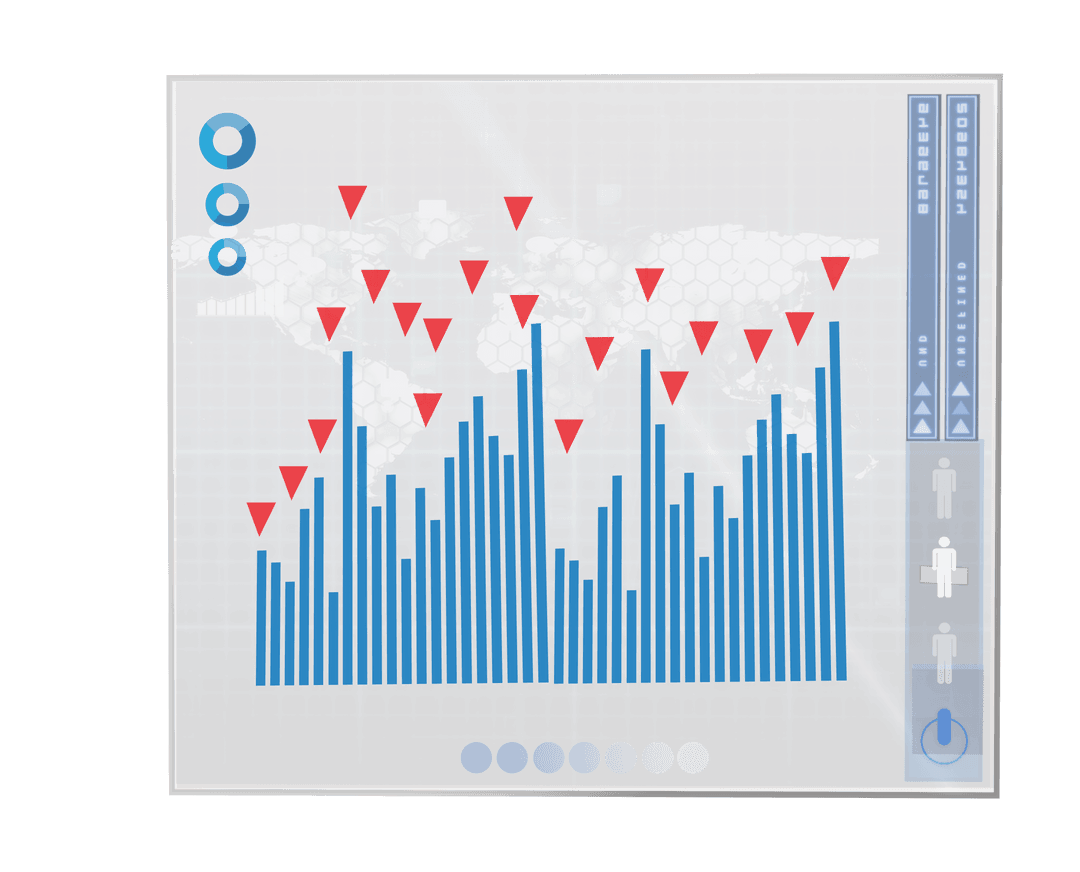
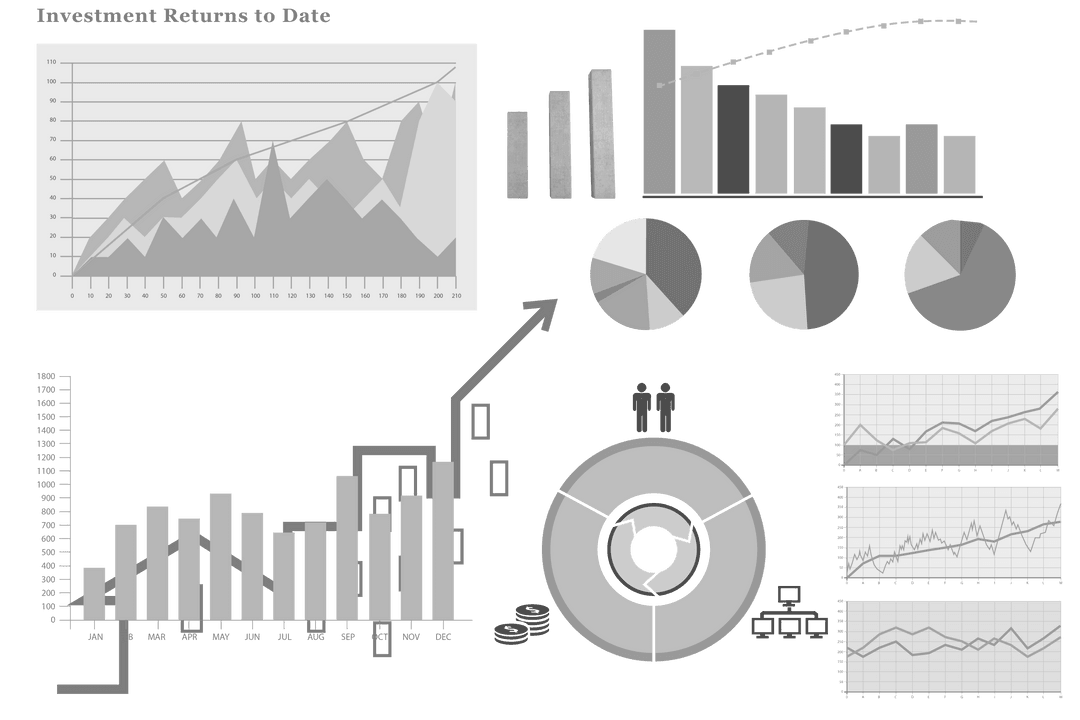
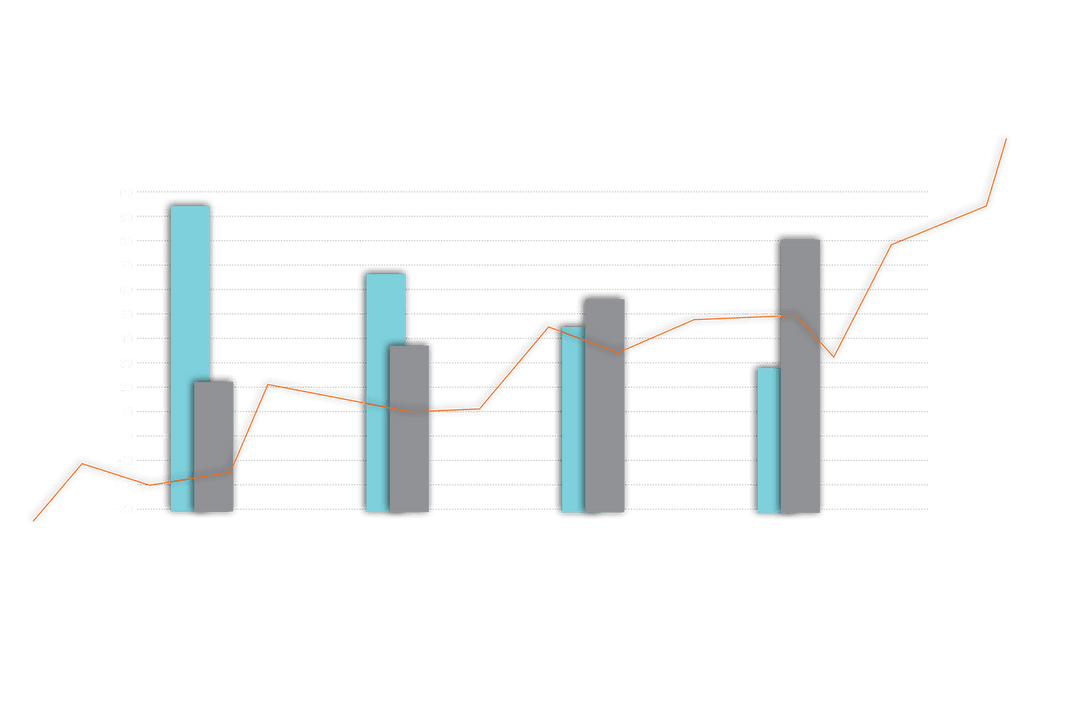
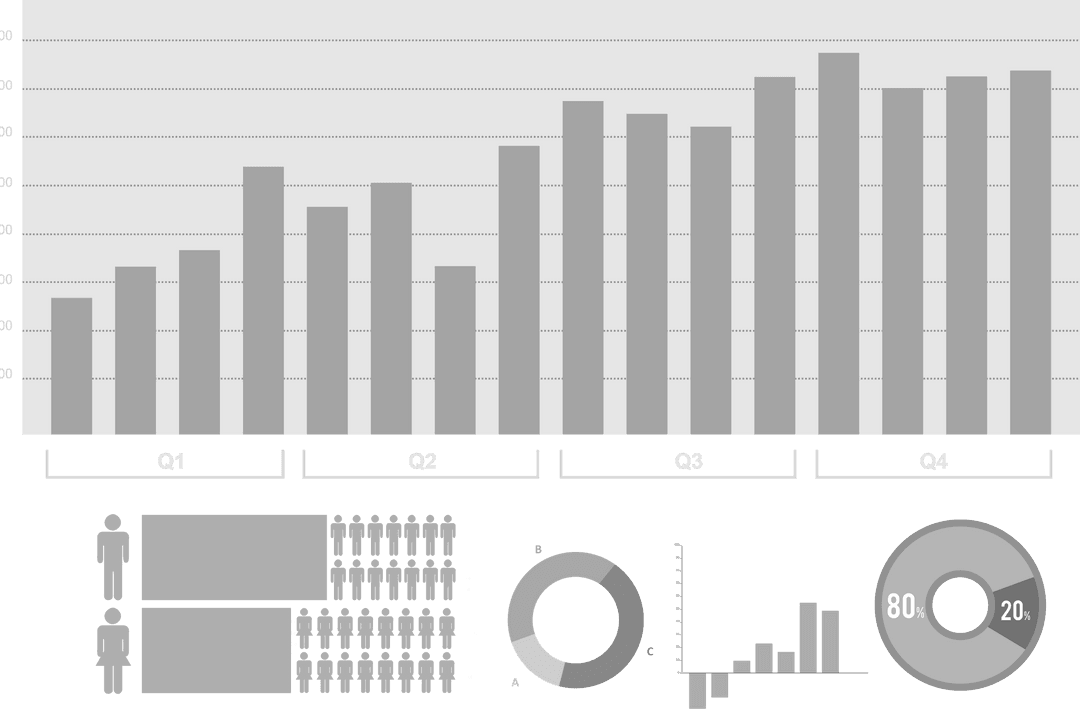
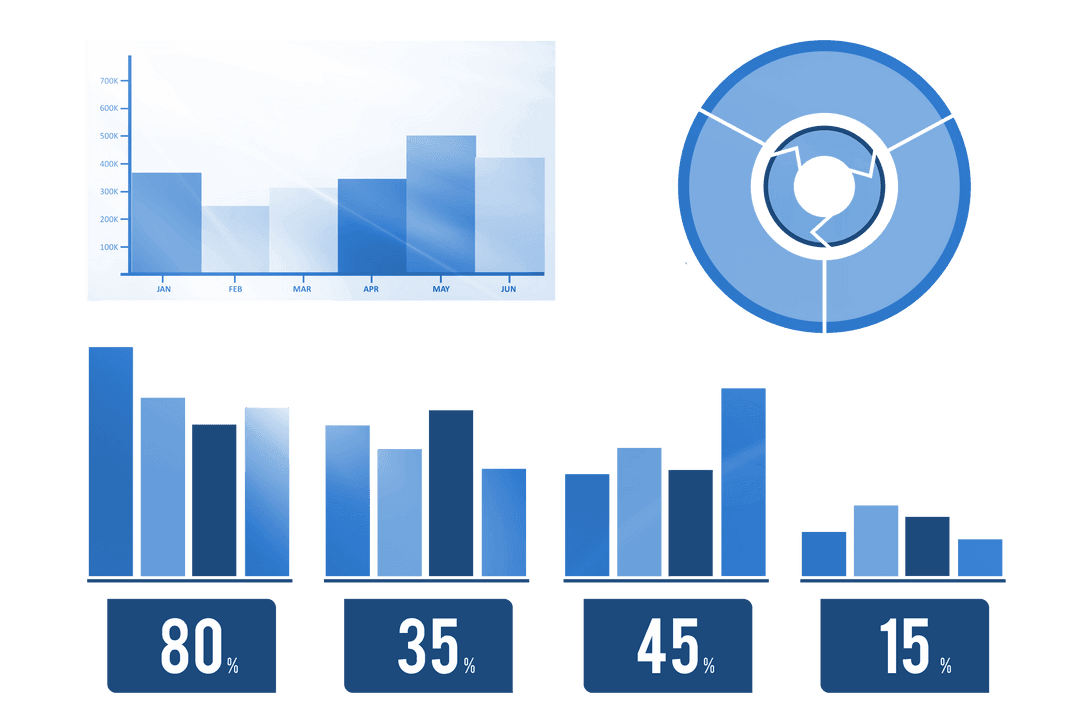
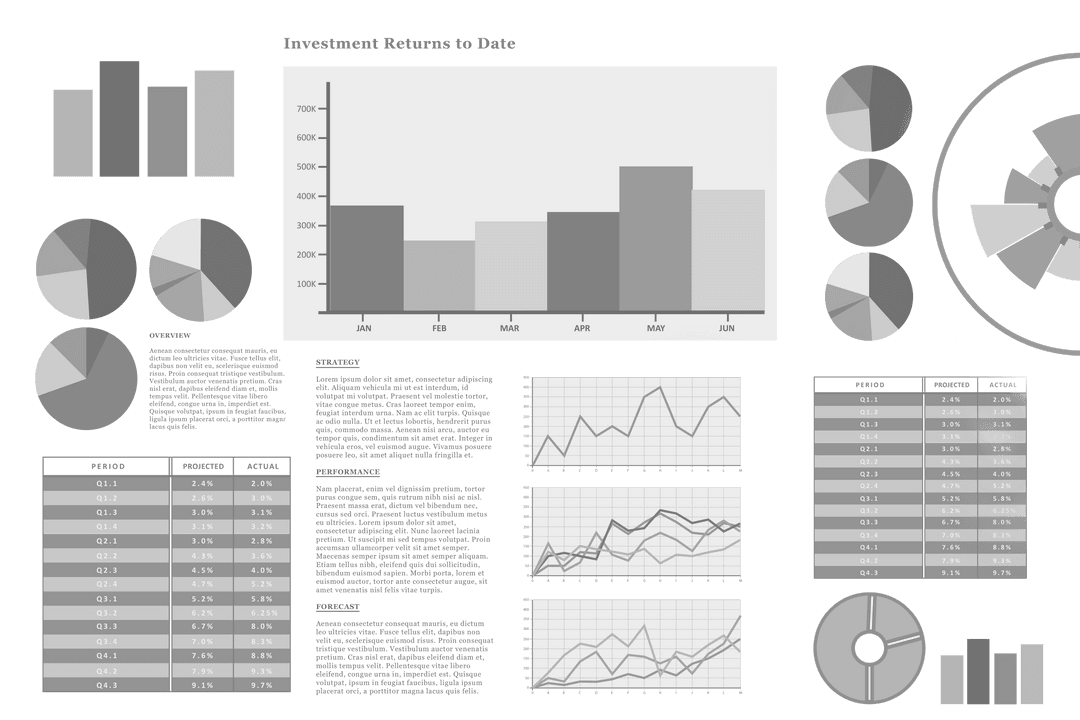
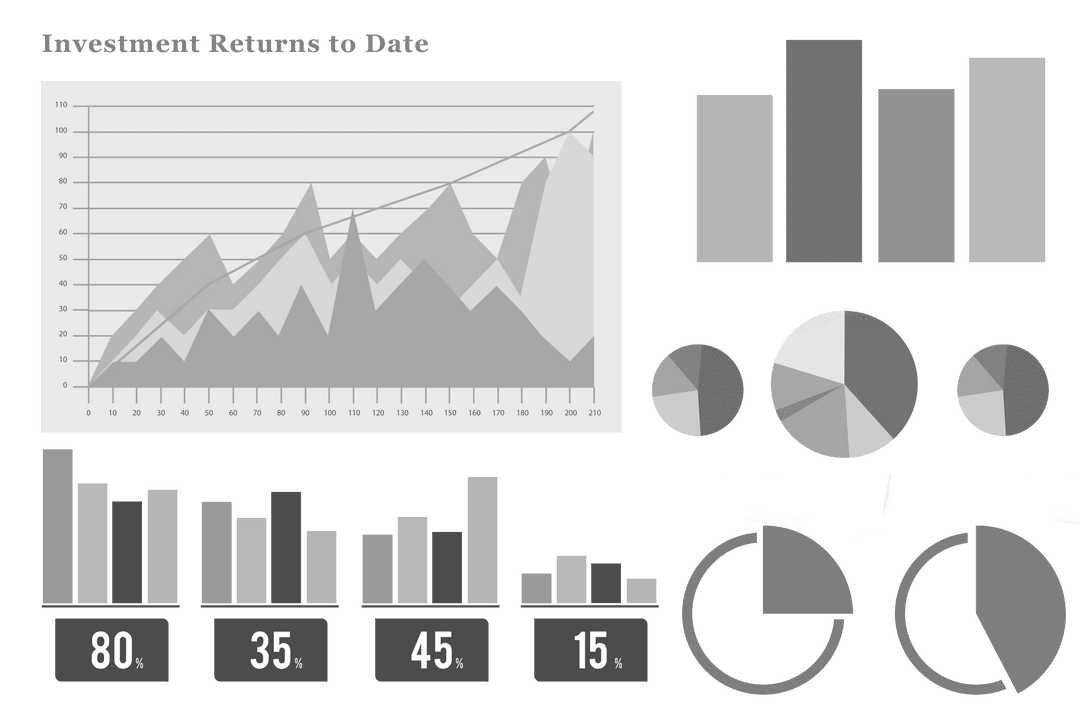
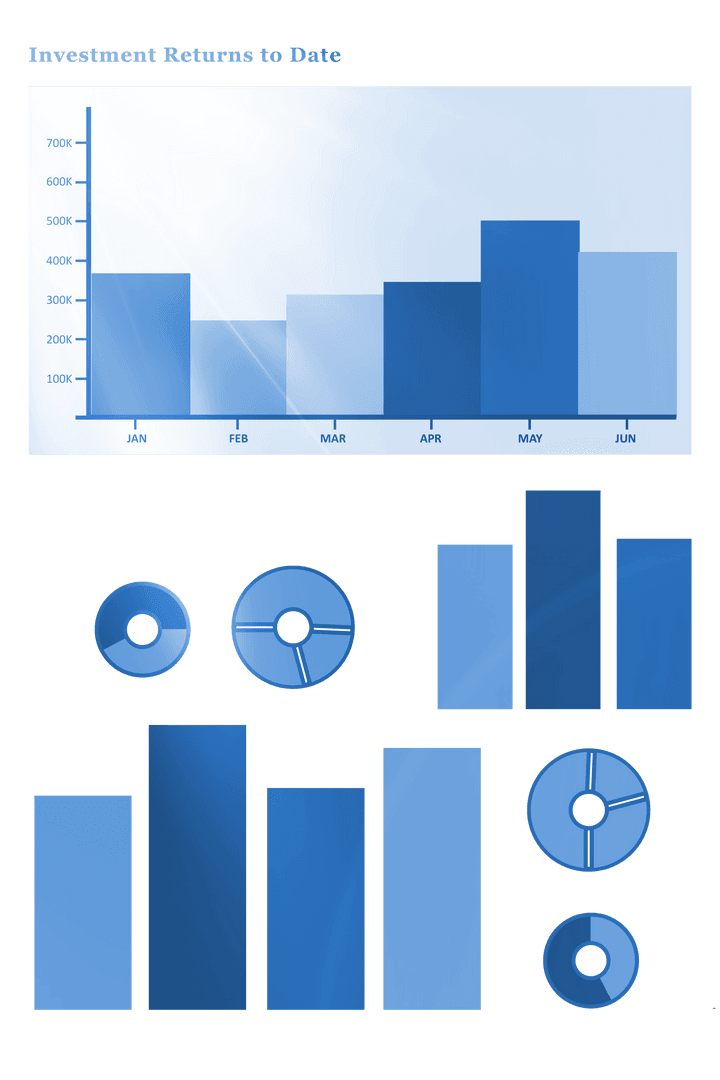
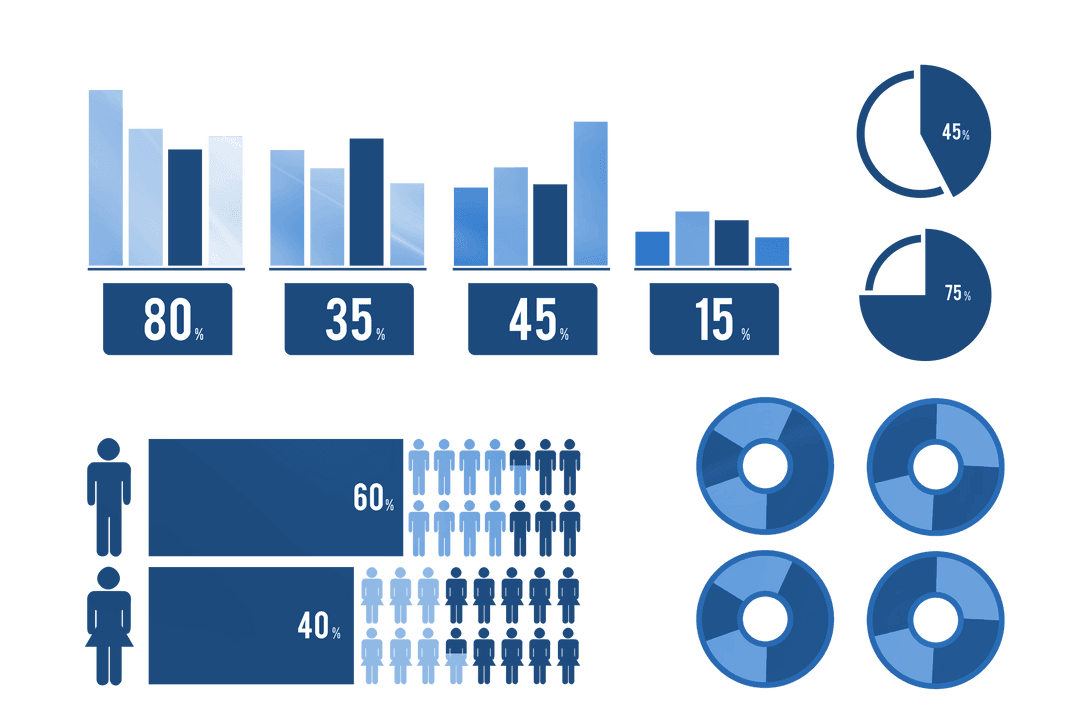
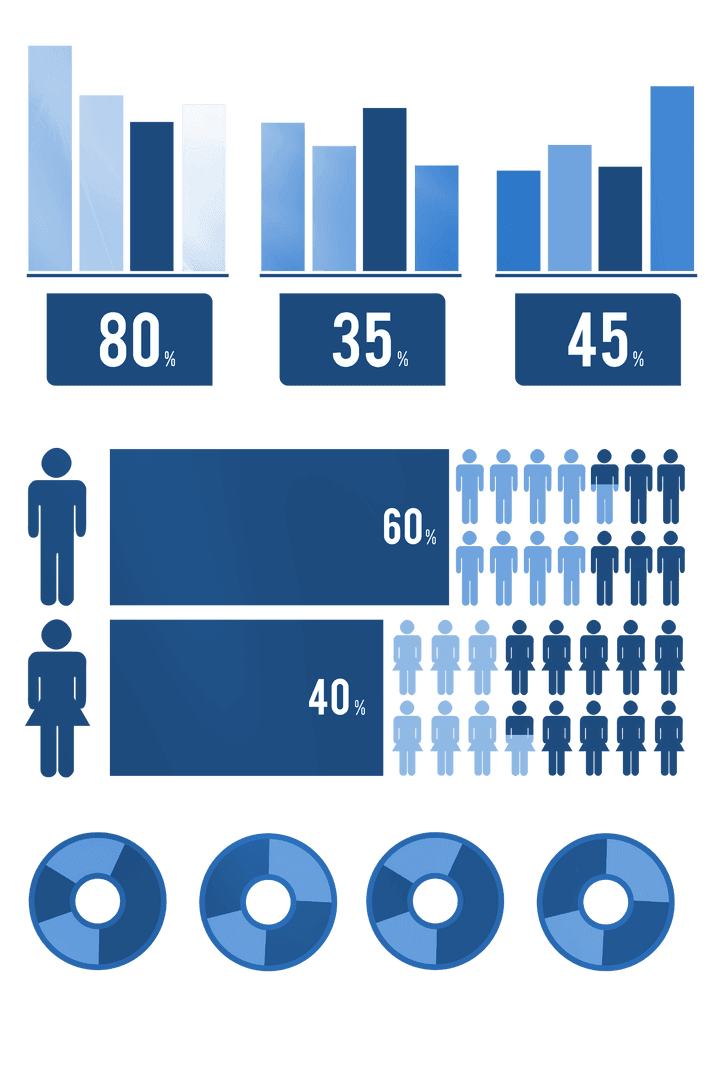
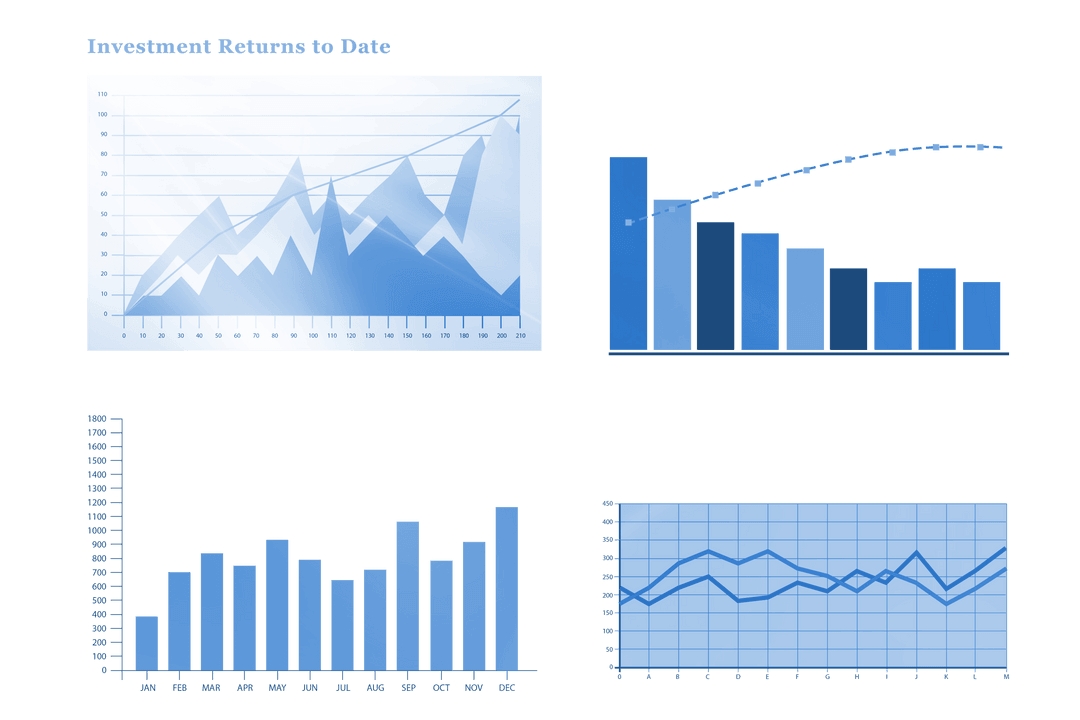
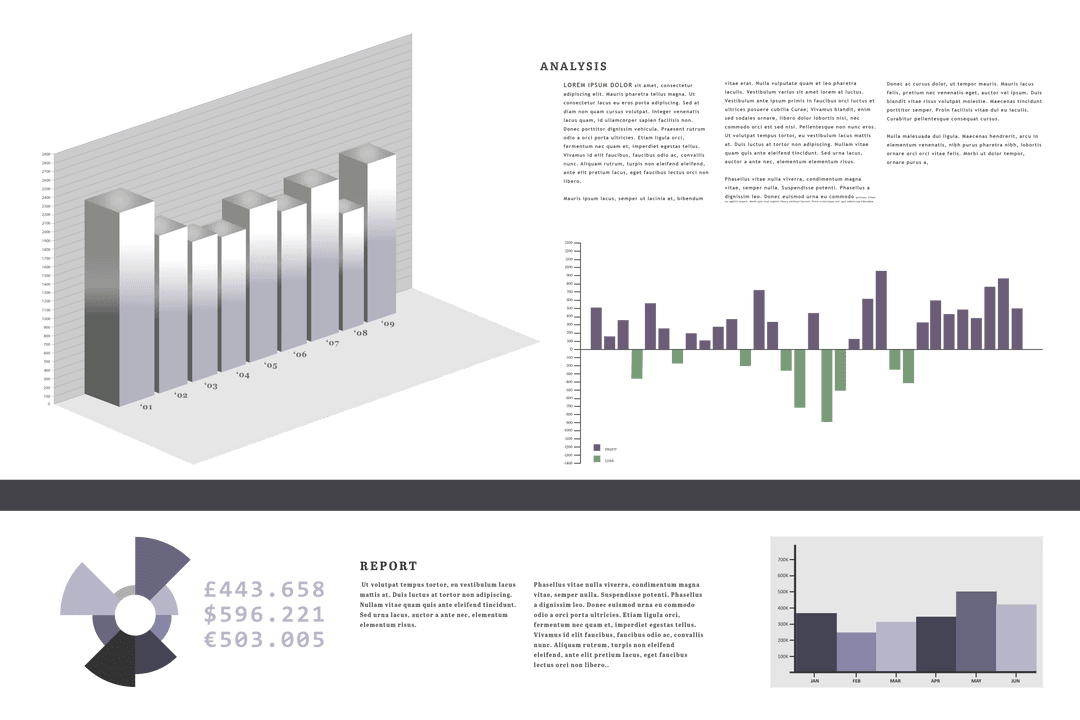
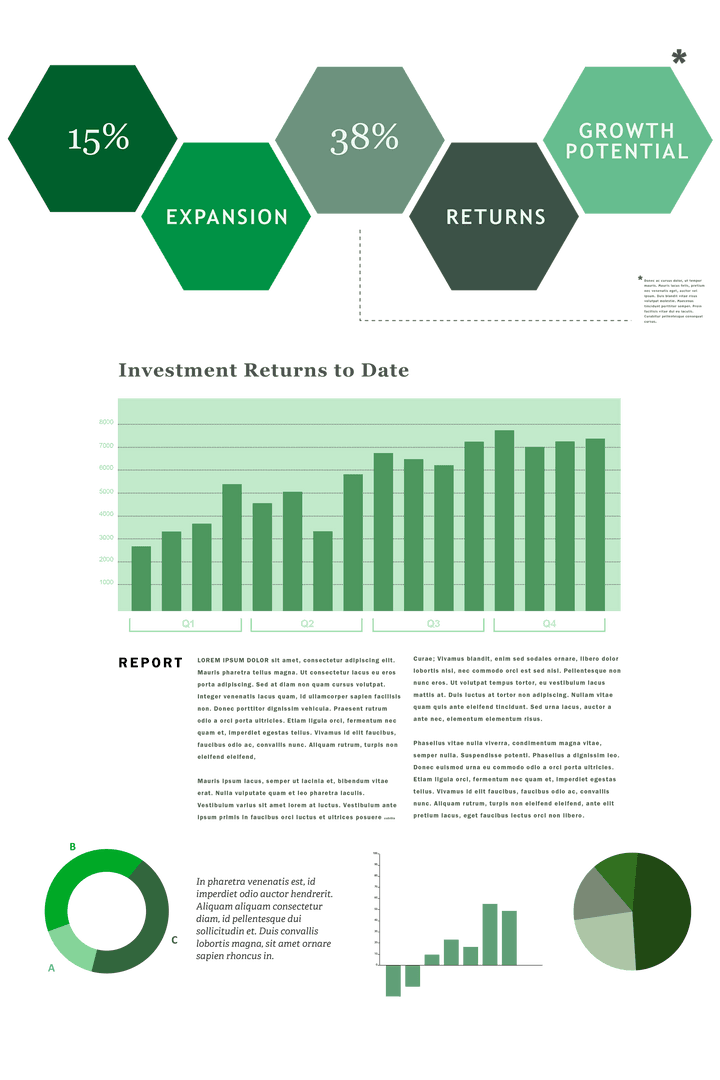
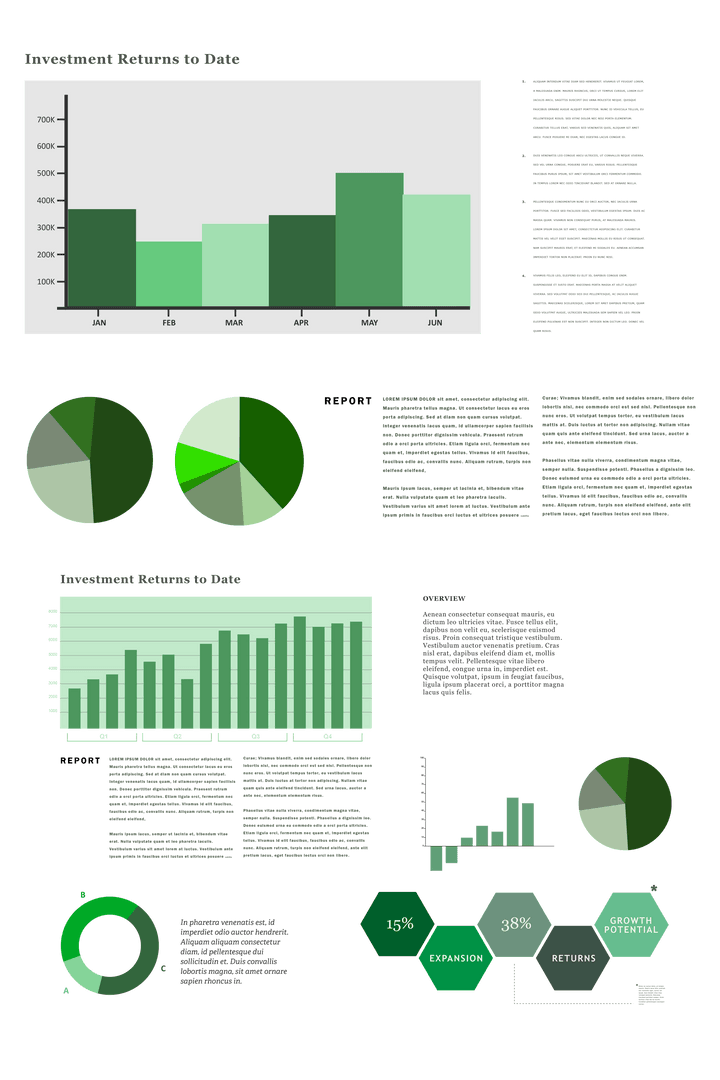
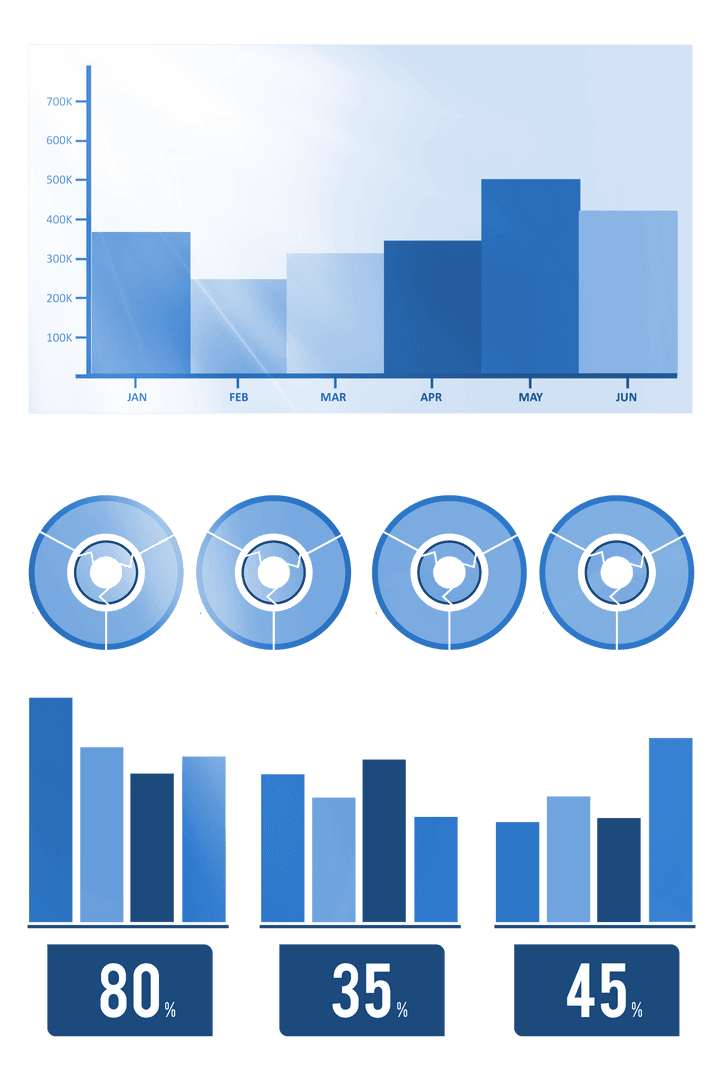
Digital blue charts demonstrate statistical data on a transparent background, ideal for presentations, educational materials, or business reports. Bar graphs and pie charts enhance understanding of financial or economic data.

Powered by Shutterstock logo - Get 15% off with code: PIKWIZARD15
Business infographics set with different diagram vector illustration. Data visualization elements, marketing charts and graphs. Website and presentation template. Abstract infographics data template. - Powered by Shutterstock - Get 15% off with code: PIKWIZARD15Growing bar graph icon set. Business graphs and charts icons. Statistics and analytics  Outline icon. Statistic and data, charts diagrams, money, down or up arrow. 
 - Powered by Shutterstock - Get 15% off with code: PIKWIZARD15Analytics screen. Dashboard data graph. Panel application UI graphic. Statistic infographic. Financial web chart. Calendar control. Digital screen. Demographic diagram. Vector business backgrounds set - Powered by Shutterstock - Get 15% off with code: PIKWIZARD15Timeline infographic design with 6 options or steps. Infographics for business concept. Can be used for presentations workflow layout, banner, process, diagram, flow chart, info graph, annual report. - Powered by Shutterstock - Get 15% off with code: PIKWIZARD15Vector infographic label design with circle infographic template design and 4-5-6 options or steps. Can be used for process diagram, presentations, workflow layout, banner, flow chart, info graph. - Powered by Shutterstock - Get 15% off with code: PIKWIZARD15

Credit Photo

If you would like to credit the Photo, here are some ways you can do so

Free (free of charge)

Free for personal and commercial use.

Author: Awesome Content

Similar Free PNG Images With Transparent Background

Transparent Statistics Chart Infographic on Grey
Premium
Dashboard app ui. Webpage dashboard with analytics charts and graphs, financial data visualization dashboards, marketing KPI statistics. Vector web app layout
Transparent Digital Data Interface with Red and Blue Bar Charts
Transparent Vector Infographics Set with Maps and Diagrams
Transparent Stacked Bar Chart with Comparisons and Colored Segments
Data Processing Visualization Graph on Transparent Background
Premium
Business infographic bar chart.report, presentation, Data, Milestone, and Infographic.
Business Data Analysis on Transparent Background
Transparent Blue Bar Graph on Dotted Paper Background
Transparent Bar Graph with Arrow Momentum Vector Illustration
Transparent Economic Trends Bar Chart Illustration
Premium
Dashboard UI, UX, KIT, great design for any site purposes. Business infographic template. Vector flat illustration. Big data concept User admin panel template design. Analytics admin dashboard.
Digital Infographic with Blue Charts on Transparent Background
Comprehensive Set of Transparent Graphs and Charts for Data Visualization
Yellow Geometric Lines Pattern on Transparent Background
Transparent Digital Data Processing Interface Vector
Premium
Infographic templates in well arranged order ready for use
Transparent Bar Graph Illustration with Segmented Columns
Digital Interface Overlay With Transparent Background for Tech Design
Transparent World Map Dashboard with Data Visualizations
Seamlessly Aligned Yellow Lines on Transparent Borderless Vector
Premium
Comprehensive Demographic and Social Trends Icon Set: 40 Thin Line Vector Icons for Population Analysis, Mortality, Longevity, Education, Employment, Gender Diversity, Family Dynamics, and Migration.
Transparent Digital Interface with Charts and Graphs Display
Transparent Digital Interface with Charts and Graphs
Abstract Blue Linear Shapes isolated on Transparent Background
Transparent Blue Elements Illustrating Business Analytics Trends
Premium
Business graphs and charts icons. Business infographics icons. Statistic and data, charts diagrams, money, down or up arrow, economy reduction. Financial chart. Vector illustration.
Transparent Bar Graph Illustration Showing Data Insights
Transparent Data Visuals Toolkit Background Workspace Design
Transparent Business Diagrams and Charts in Grayscale
Transparent Data Visualization with Graphs and Human Icons
Transparent Vector Statistics Infographic for Business and Finance
Transparent Digital Interface Showing Virus Detection Message
Premium
Circle chart infographic template with 4 options for presentations
Transparent Data Processing and Technology Illustration
Blue Financial Growth Chart with Rising Arrow Illustrating Investment Success
Transparent Data Processing Interface with Graphs and Status Elements
Financial Diagram Illustration on Transparent Background with Data Trends
Premium
Infographic template. 6 Step timeline journey, Flat simple infographics design template. presentation graph. Business concept with numbers 6 options or steps vector illustration.
Green Infographic with Graphs on Transparent Background for Business Illustration
White Bar Graph Icon on Transparent Background
Colorful Digital Equalizer on Transparent Background
Transparent Infographic Elements for Statistical Representation
Premium
Modern presentation slide templates. Infographic elements template set for web, print, annual report brochure, business flyer leaflet marketing and advertising template. Vector Illustration.
Growth Chart with Red Arrow on Transparent Background
Transparent Business Data Chart Infographic with Laptop
Transparent Data Analysis with Graphs and Human Representation
Transparent Medical Dashboard Display with Global Data Map
Premium
Abstract infographic visualization. Financial chart with uptrend line graphs and candlesticks. Futuristic network or business analytics. Graphic concept for your design.
Transparent Chart Illustrating Financial Growth Trends
Digital Bar and Circle Charts on Transparent Background
Vector Data Charts and Graphs on Transparent Background for Presentations
Transparent Data Visualization Diagrams and Graphs Set
Premium
Infographic chart. Graph colorful elements, graphic business, presentation document corporate. Info design, data bars modern blue growth. Structure and timeline. Vector background tidy information set
White Linear Abstract Design on Transparent Background
Digital Interface Charts on Transparent Background for Business Data Analysis
Gray Column Chart With Trend Arrow on Transparent Background
Transparent Analysis Chart on Digital Interface Display
Premium
Modern infographic template with statistics finance charts. Infographics dashboard. Admin panel interface with color charts, graphs on white background. Illustration flowchart and diagram and workflow
Transparent Digital Interface with Statistic Charts for Finance
Transparent Diagrams and Data Analysis Concept Illustration
Transparent Pattern of Ice Blue Glazed Tiles
Business Data Processing Diagrams on Transparent Background
Digital Music Mixer Illustration on Transparent Background Creativity
White Bar Graph on Transparent Background for Data Trends
Premium
Abstract infographic visualization. Financial chart with uptrend line graphs and candlesticks. Futuristic network or business analytics. Graphic concept for your design.
Transparent Business Statistics Charts and Graphs for Data Analysis
Abstract Blue Vertical Lines Pattern on Transparent Background
Transparent Charts and Graphs for Finance Presentations
Digital Yellow Line Pattern on Transparent Background Design Idea
Premium
Vector infographic label design with circle infographic template design and 5 options or steps. Can be used for process diagram, presentations, workflow layout, banner, flow chart, info graph.
Green Graph on Transparent Background Showing Data Visualization Statistics
Transparent Graphs Vector with Percentage Data and Figures
Transparent Business and Economy Chart Diagrams
Green Transparent Charts and Data Illustration
Premium
Modern presentation slide templates. Infographic elements template set for web, print, annual report brochure, business flyer leaflet marketing and advertising template. Vector Illustration.
Business Growth Statistics Illustration with Graph & Icons on Transparent Background
Dynamic Data Processing Interface on Transparent Canvas
Digital Analytics and Statistics on Transparent Background
Transparent Overlay of White Statistic Charts and Graphs for Business
Premium
Flat vector design statistical and Data analysis for business finance investment concept with business people team working on monitor graph dashboard
Modern Digital Interface with Transparent Elements and Charts
Transparent Bar Chart Illustration for Data Presentation
Transparent Red Green Bar Chart Data Visualization Background
Colorful Abstract Bars on Transparent Background
Premium
Isometric Expert team for Data Analysis, Business Statistic, Management, Consulting, Marketing. Communication and contemporary marketing. Corporate people working together
Digital Bar Chart on Transparent Background for Business Presentations
Increasing Column Chart with Arrows on Transparent Background
Blue Bar Graph Infographic on Transparent Background Data Visualization
Transparent Background Human Data Infographic Collection
Premium
Vector infographic design template with 3 options or steps
Abstract Yellow Linear Shapes on Transparent Background
Transparent Statistics Data Processing Conceptual Illustration
Transparent Digital Dashboard Interface with Analytics and Metrics
Transparent Digital Data Processing Interface Element
Blue Data Processing Diagrams on Transparent Background for Business
Transparent Data Processing Diagram with Bar Charts
Premium
set of colorful dark cool pie chart, visual chart
Transparent Financial Chart Depicting Investment Returns Growth
Blue Diagram Elements on Transparent Background for Business Analytics
Blue Financial Diagrams on Transparent Background for Business Concepts
Abstract Blue Lines Pattern on Transparent Vector Background
Premium
Modern presentation slide templates. Infographic elements template set for web, print, annual report brochure, business flyer leaflet marketing and advertising template. Vector Illustration.
Transparent Vector Business Growth Analysis Chart
Transparent Background Blue Chart Diagrams Vector for Business
Transparent Illustration of Bar Graph with Red Arrow Uptrend
Business Chart and Diagram Collection on Transparent Background
Premium
Set elements of infographics
Blue Line Pattern on Transparent Background for Vector Designs
Business Interface Showing Transparent Growth and Investment Insights
Green Financial Diagrams on Transparent Background for Business Concepts
Black Line Pattern Illustration on Transparent Vector Design
Premium
Modern presentation slide templates. Infographic elements template set for web, print, annual report brochure, business flyer leaflet marketing and advertising template. Vector Illustration.
Digital Blue Charts on Transparent Background for Business Analysis
Transparent Medical Statistics Interface with Data Visualizations
Blue Lines Pattern on Transparent Background for Creative Design
Growth Chart with Bold Arrows Overlay in Transparent Format
Premium
Set of colorful infographic percentage piecharts, segment of hole circle icons 10% - 100%, simple flat design loading data interface elements app button ui ux web, vector isolated on white background
Transparent Background Modern Mixing Console Illustration
Transparent Bar Graph for Data Presentation
Transparent Bar Chart Illustration with Blue and Red Columns
Blue Statistic Comparison Jan-Jun on Transparent Background for Business Usage
Premium
Modern presentation slide templates. Infographic elements template set for web, print, annual report brochure, business flyer leaflet marketing and advertising template. Vector Illustration.
Abstract Geometric Hello Maze on Transparent Background