- Home >
- Stock PNGs >
- Colorful Transparent Statistics Chart Illustration
Colorful Transparent Statistics Chart Illustration PNG
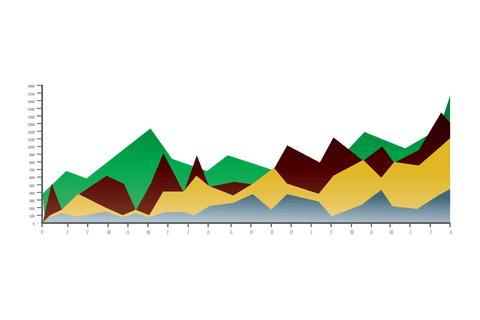
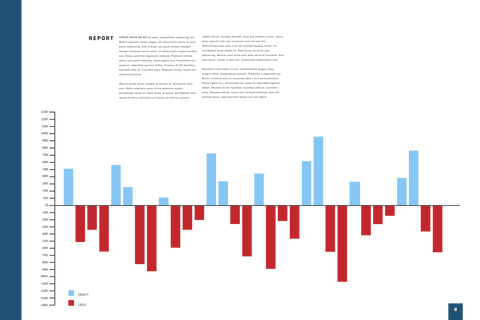
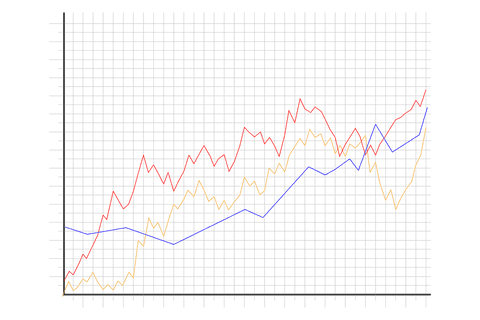
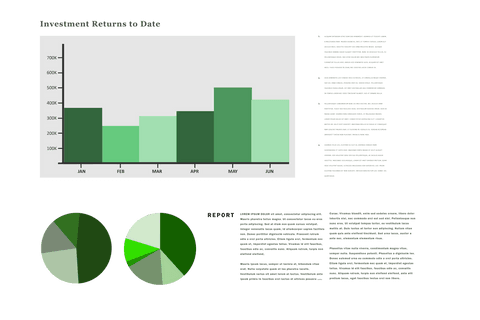
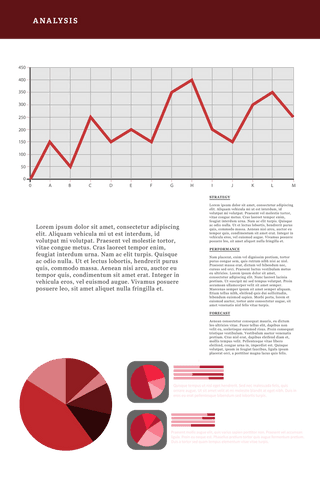
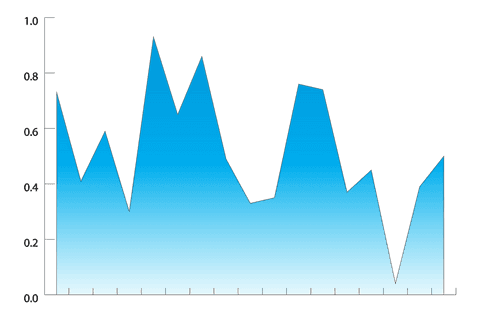
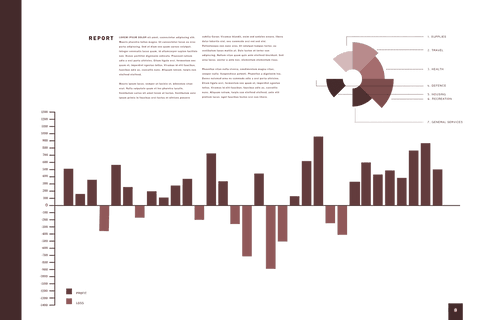
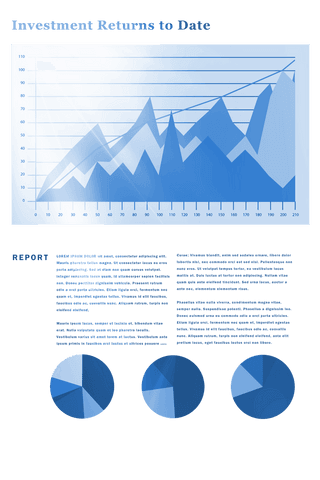
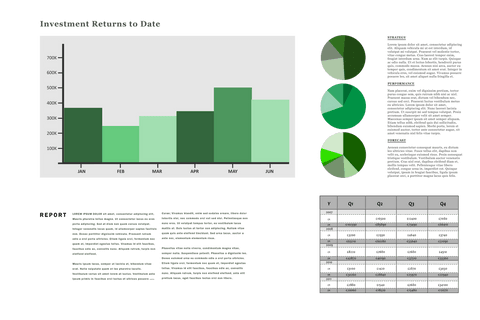
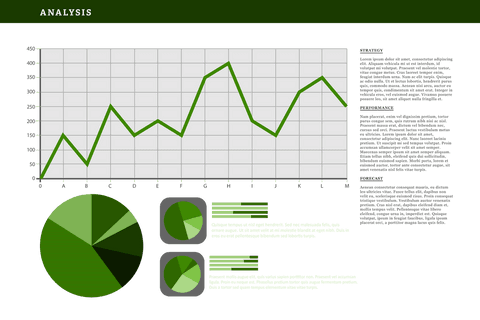
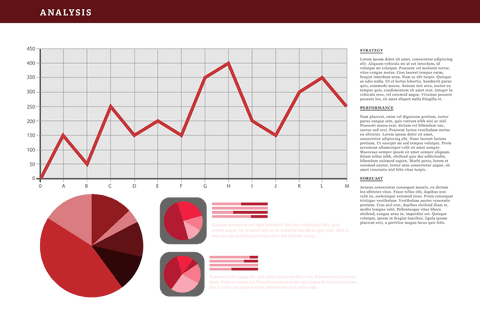
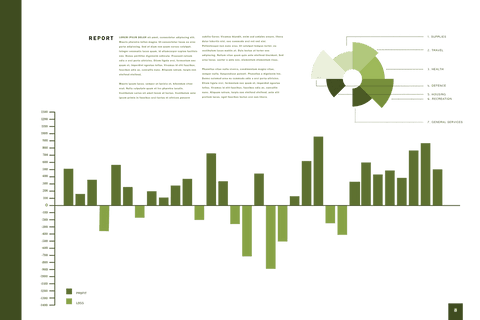
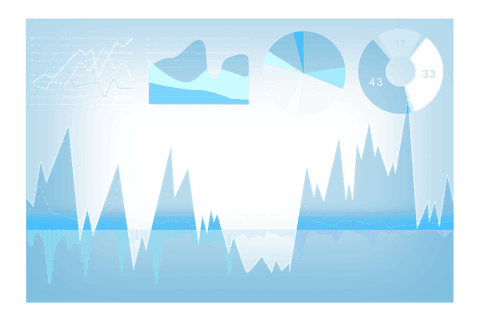
Transparent illustration of a colorful statistics chart with multi-colored geometric shapes. Represents data analysis and reporting concepts. Useful for business presentations, educational materials, or websites demonstrating statistical and analytical processes. Sophisticated design enhances professional insight into statistical data visualization.
Powered by 


Credit Photo
If you would like to credit the Photo, here are some ways you can do so
Text Link
png Link
<span class="text-link">
<span>
<a target="_blank" href=https://pikwizard.com/png/colorful-transparent-statistics-chart-illustration/5bd877d08ca5d0bdd786e1a509b94a6d/>PikWizard</a>
</span>
</span>
<span class="image-link">
<span
style="margin: 0 0 20px 0; display: inline-block; vertical-align: middle; width: 100%;"
>
<a
target="_blank"
href="https://pikwizard.com/png/colorful-transparent-statistics-chart-illustration/5bd877d08ca5d0bdd786e1a509b94a6d/"
style="text-decoration: none; font-size: 10px; margin: 0;"
>
<img src="https://pikwizard.com/pw/medium/5bd877d08ca5d0bdd786e1a509b94a6d.png" style="margin: 0; width: 100%;" alt="" />
<p style="font-size: 12px; margin: 0;">PikWizard</p>
</a>
</span>
</span>
Free (free of charge)
Free for personal and commercial use.
Author: Authentic Images
Similar Free PNG Images With Transparent Background
Premium


Premium


Premium


Premium

Premium


Premium


Premium


Premium


Premium


Premium


Premium


Premium


Premium


Premium


Premium


Premium


Premium


Premium


Premium


Premium


Premium


Premium


Premium


Premium


Premium