- Home >
- Stock PNGs >
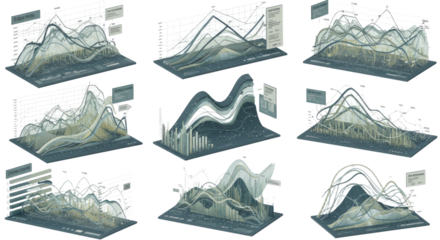
- Comprehensive Set of Transparent Graphs and Charts for Data Visualization
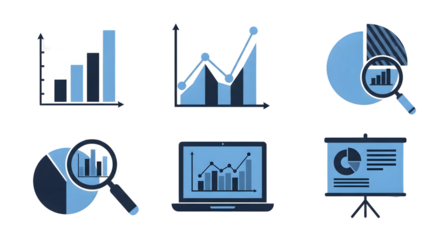
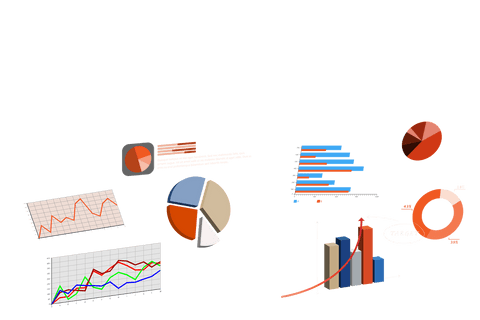
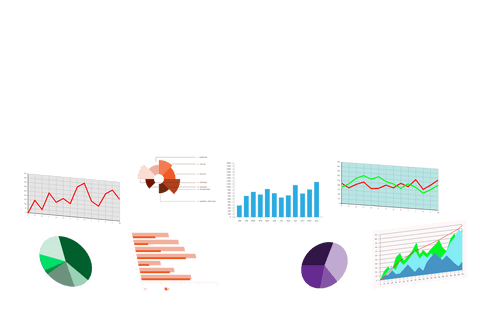
Comprehensive Set of Transparent Graphs and Charts for Data Visualization PNG
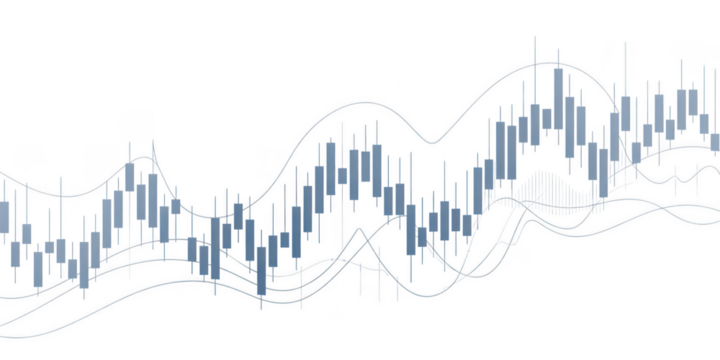
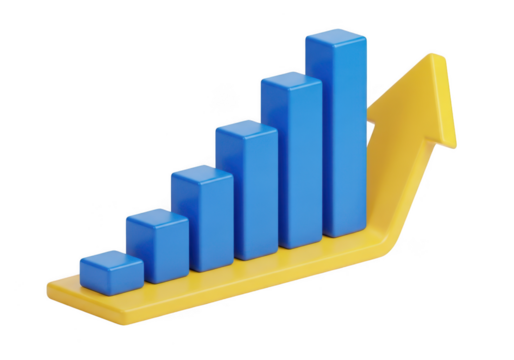
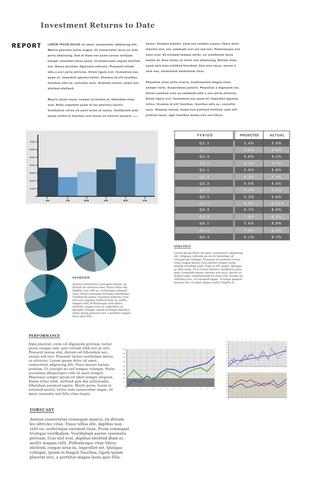
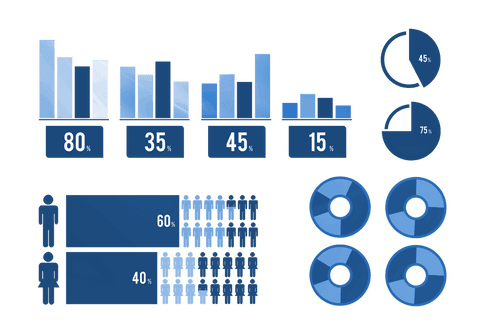
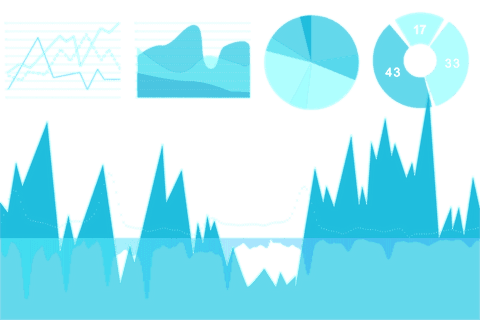
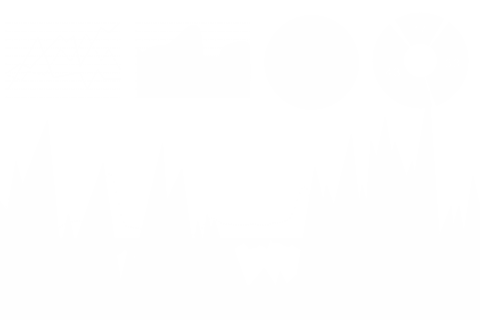
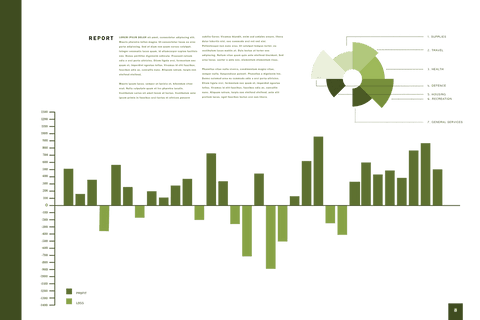
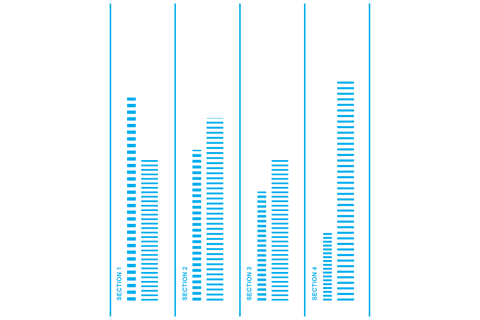
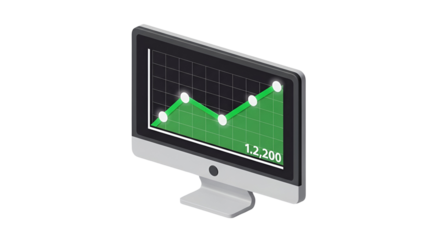
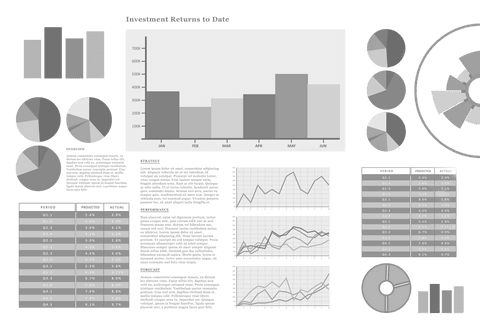
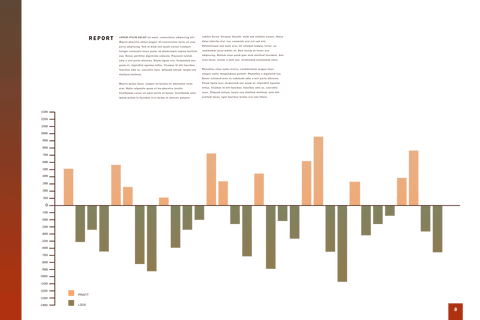
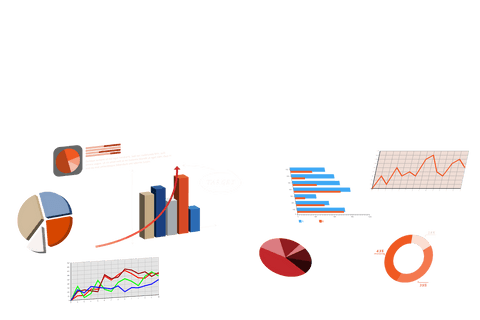
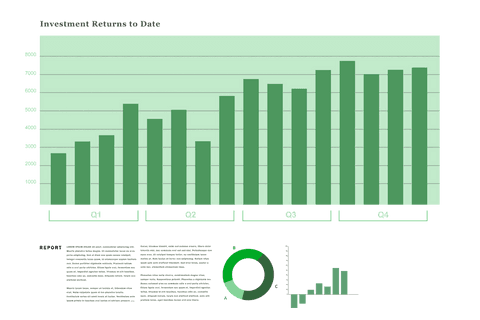
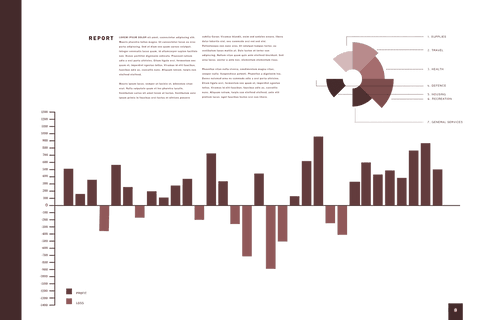
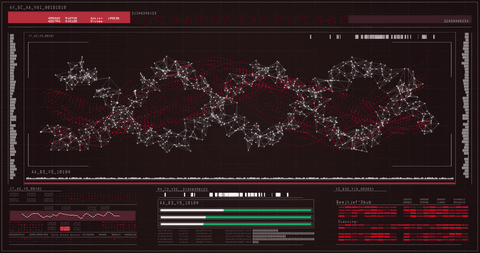
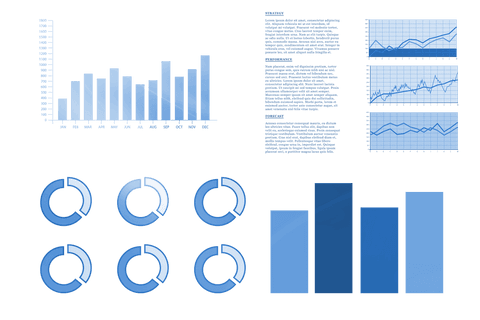
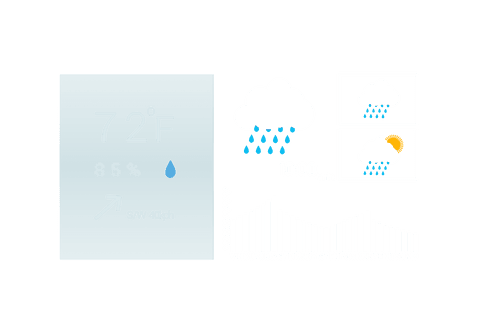
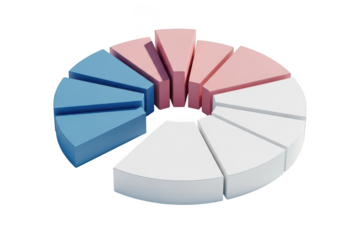
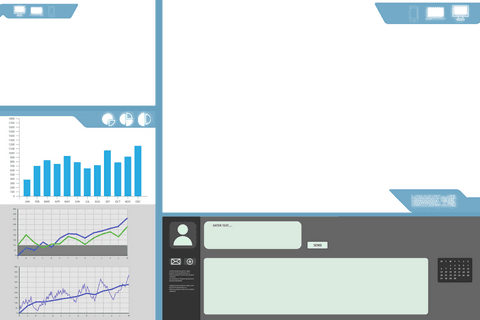
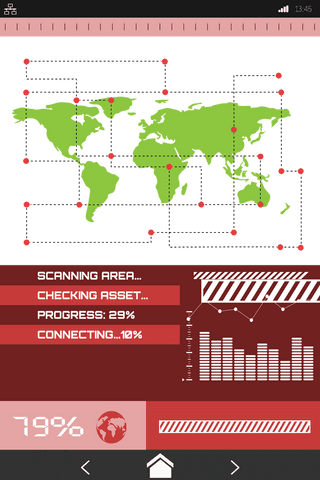
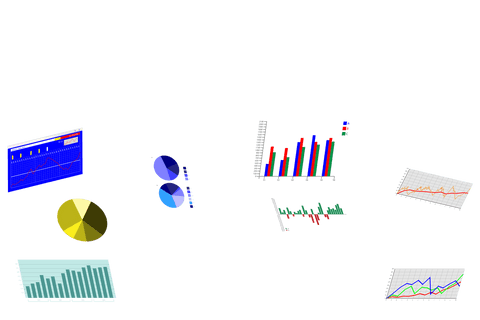
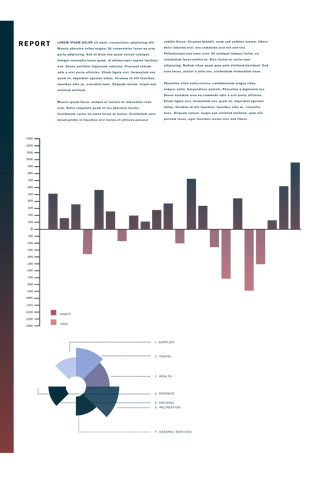
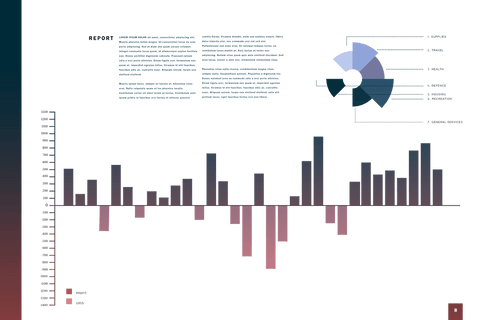
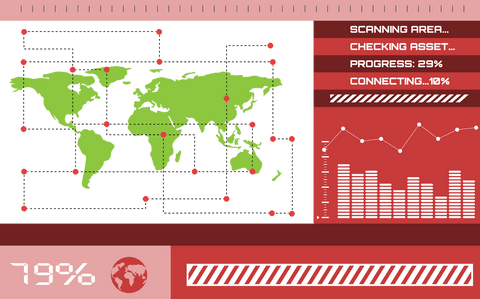
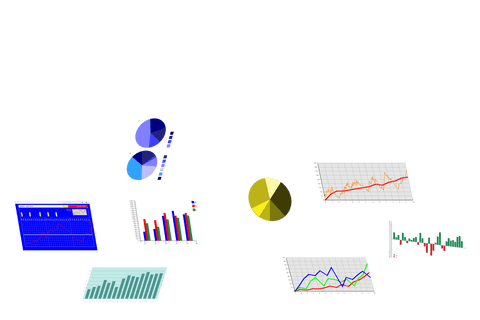
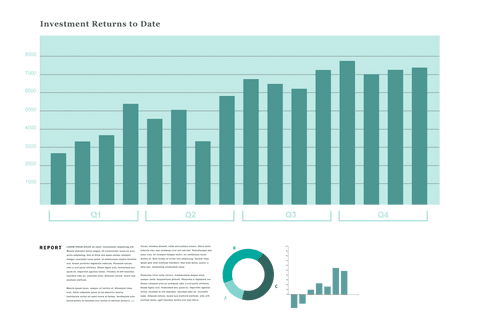
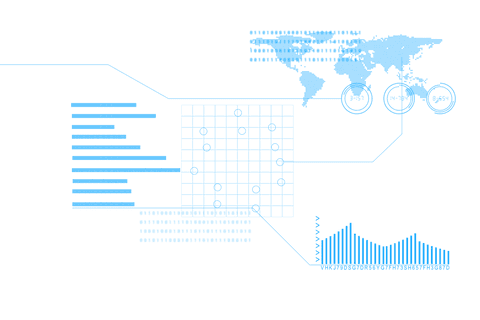
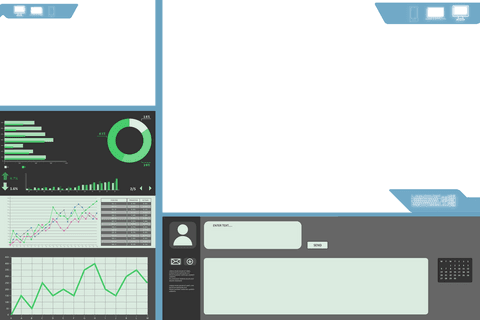
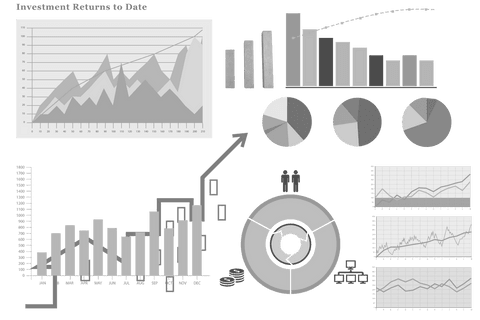
This creative set of transparent graphs and charts serves as an ideal tool for presentations, reports, or infographic creation. Easily incorporate into diverse projects that require illustrating data insights, trends, or global statistics. The inclusion of line graphs, bar charts, pictographs, and a world map enhances its utility for academics, businesses, and educational content developers.
Powered by 


downloads
Tags:
More
Credit Photo
If you would like to credit the Photo, here are some ways you can do so
Text Link
png Link
<span class="text-link">
<span>
<a target="_blank" href=https://pikwizard.com/png/comprehensive-set-of-transparent-graphs-and-charts-for-data-visualization/c6c6bac89354f5faafdd7635af00c622/>PikWizard</a>
</span>
</span>
<span class="image-link">
<span
style="margin: 0 0 20px 0; display: inline-block; vertical-align: middle; width: 100%;"
>
<a
target="_blank"
href="https://pikwizard.com/png/comprehensive-set-of-transparent-graphs-and-charts-for-data-visualization/c6c6bac89354f5faafdd7635af00c622/"
style="text-decoration: none; font-size: 10px; margin: 0;"
>
<img src="https://pikwizard.com/pw/medium/c6c6bac89354f5faafdd7635af00c622.png" style="margin: 0; width: 100%;" alt="" />
<p style="font-size: 12px; margin: 0;">PikWizard</p>
</a>
</span>
</span>
Free (free of charge)
Free for personal and commercial use.
Author: People Creations
Similar Free PNG Images With Transparent Background
Loading...

Premium

Premium

Premium


Premium


Premium


Premium


Premium

Premium
Premium


Premium


Premium


Premium


Premium

Premium

Premium


Premium


Premium


Premium


Premium

Premium

Premium


Premium


Premium

Premium

Premium