- Home >
- Stock PNGs >
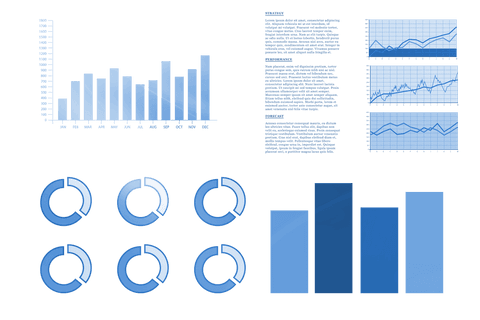
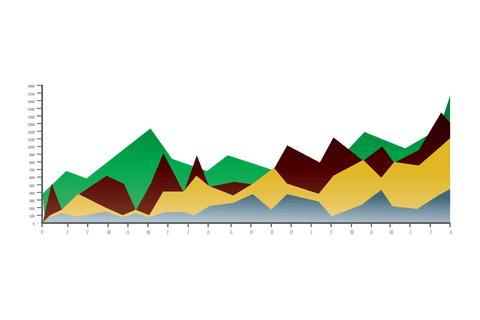
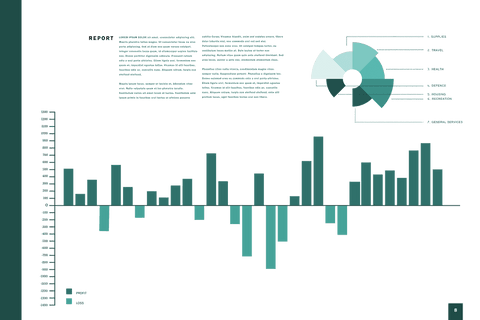
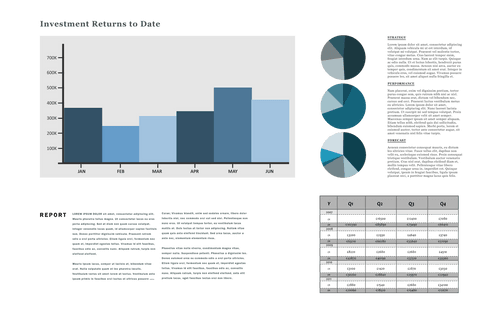
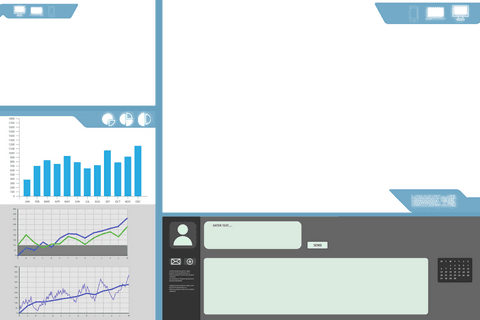
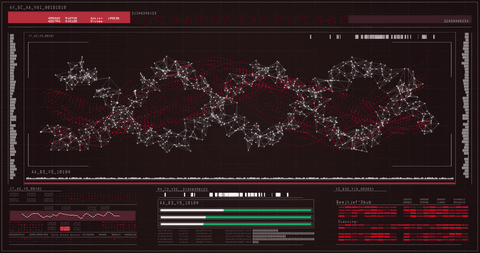
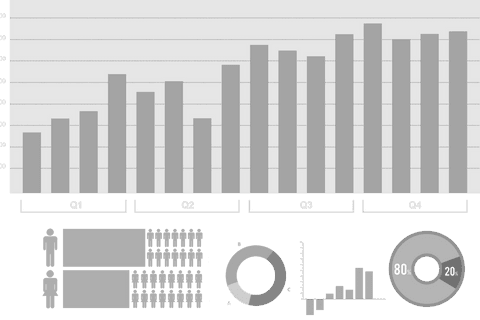
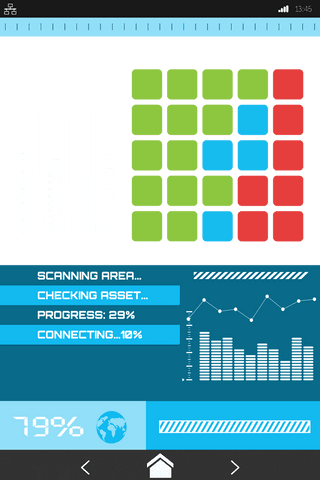
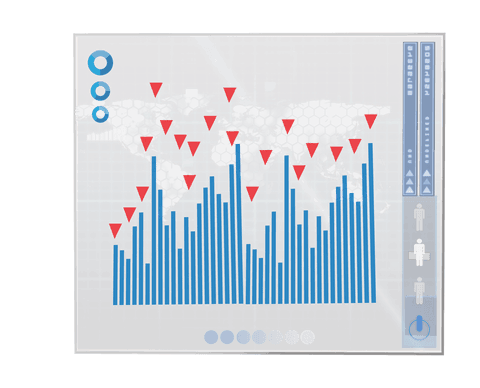
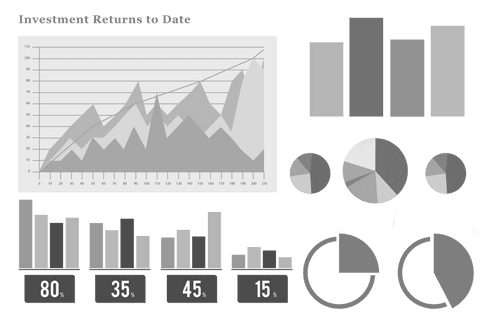
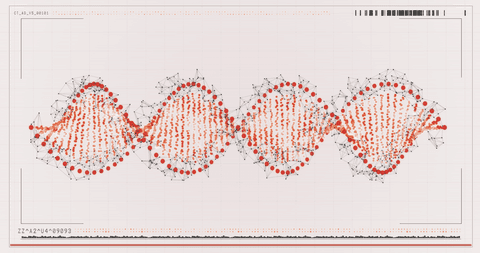
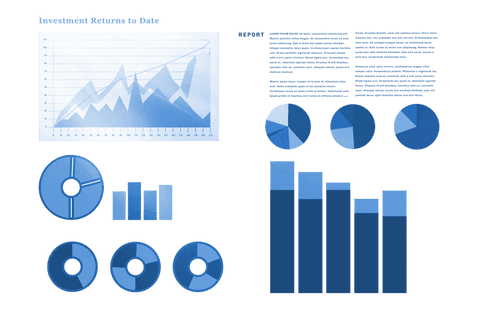
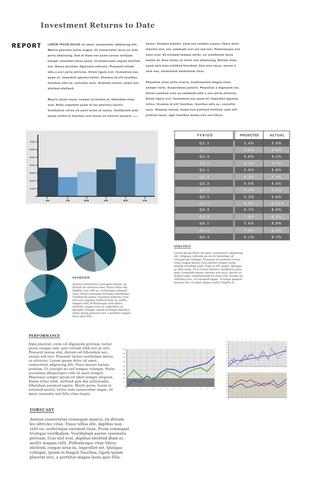
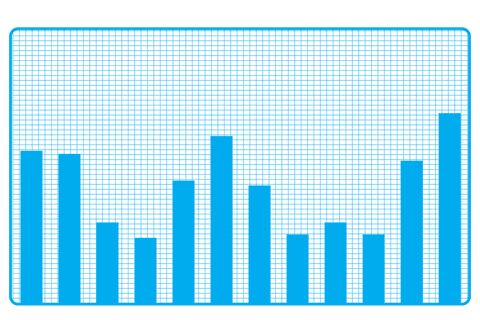
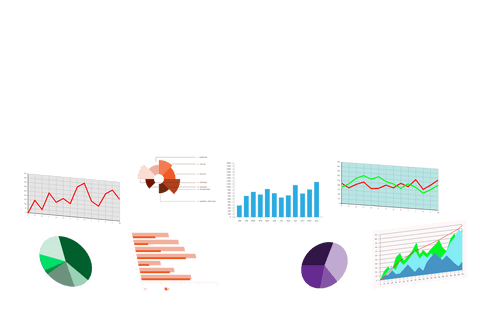
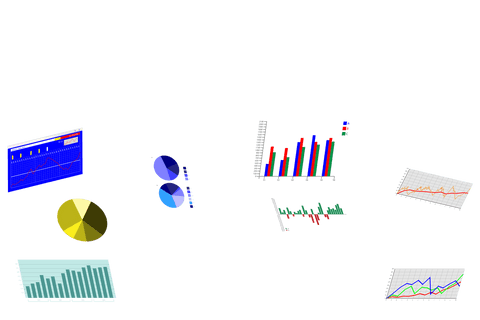
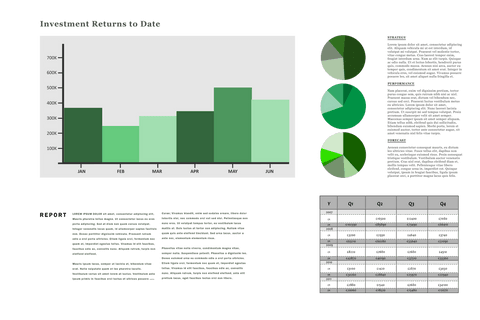
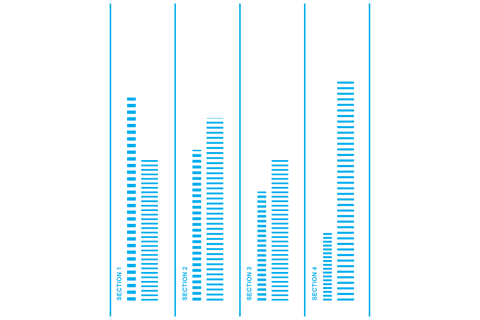
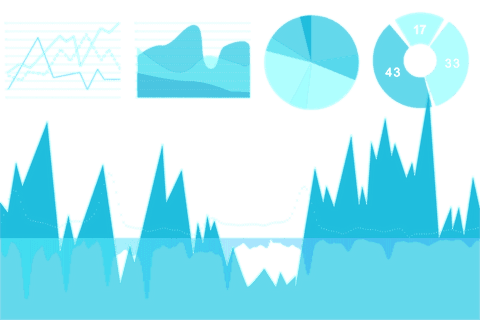
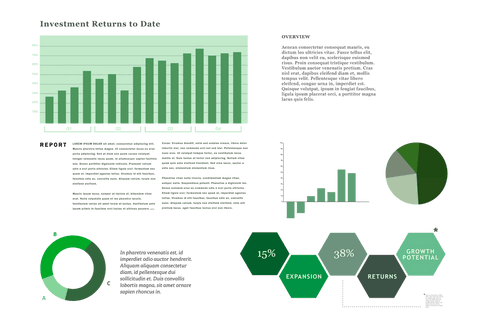
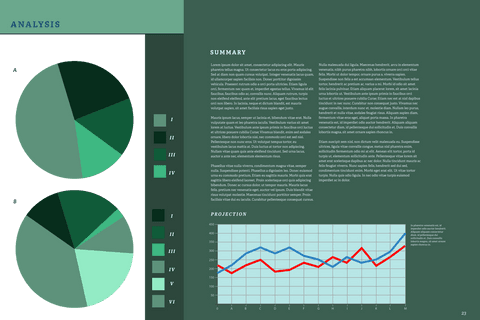
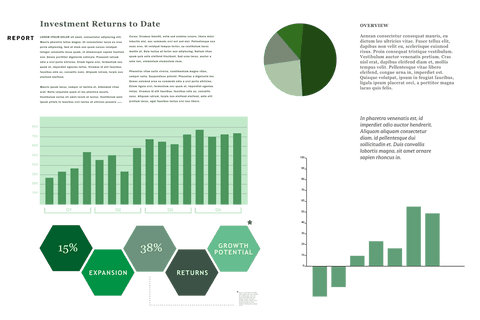
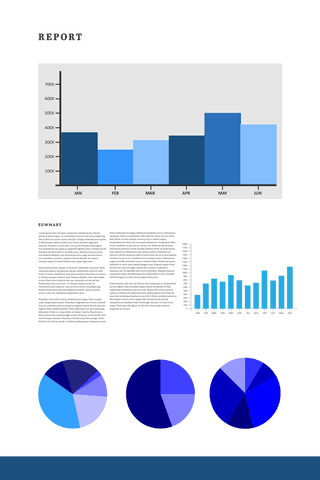
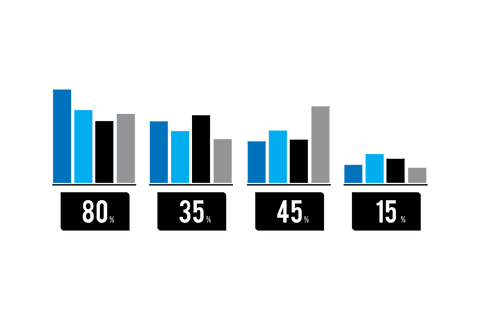
- Data Processing Visualization Graph on Transparent Background
Data Processing Visualization Graph on Transparent Background PNG
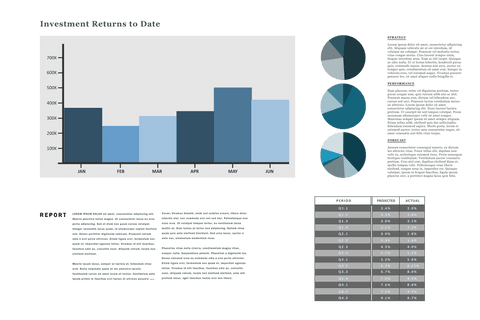
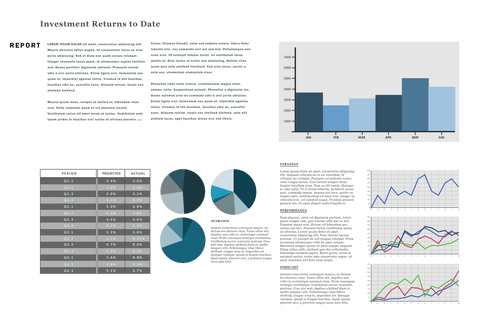
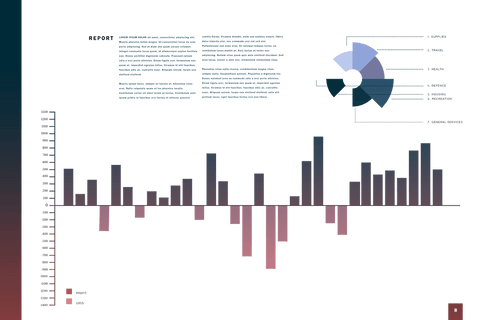
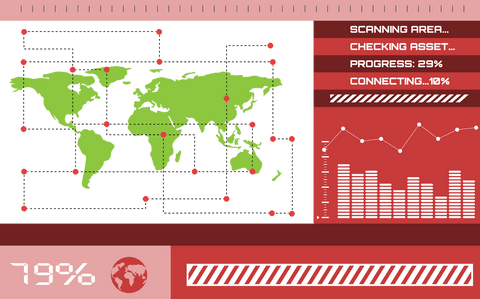
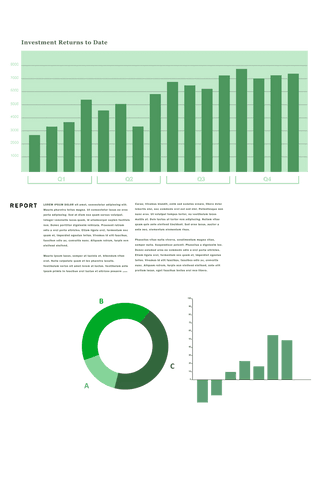
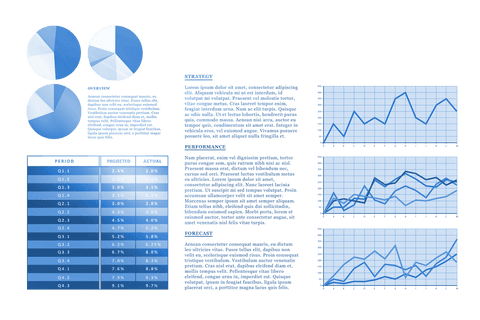
This digital illustration depicts a graph highlighting data processing metrics, useful for business and finance projects on transparent backgrounds. It is ideal for presentations, reports, or educational materials focusing on computing and numerical analysis. This versatile vector art enables integration into multiple design formats.

downloads
Tags:
Credit Photo
If you would like to credit the Photo, here are some ways you can do so
Text Link
png Link
<span class="text-link">
<span>
<a target="_blank" href=https://pikwizard.com/png/data-processing-visualization-graph-on-transparent-background/dc82b41954d0571b40456637c4d2ffee/>PikWizard</a>
</span>
</span>
<span class="image-link">
<span
style="margin: 0 0 20px 0; display: inline-block; vertical-align: middle; width: 100%;"
>
<a
target="_blank"
href="https://pikwizard.com/png/data-processing-visualization-graph-on-transparent-background/dc82b41954d0571b40456637c4d2ffee/"
style="text-decoration: none; font-size: 10px; margin: 0;"
>
<img src="https://pikwizard.com/pw/medium/dc82b41954d0571b40456637c4d2ffee.png" style="margin: 0; width: 100%;" alt="" />
<p style="font-size: 12px; margin: 0;">PikWizard</p>
</a>
</span>
</span>
Free (free of charge)
Free for personal and commercial use.
Author: Authentic Images