
- Home >
- Stock PNGs >
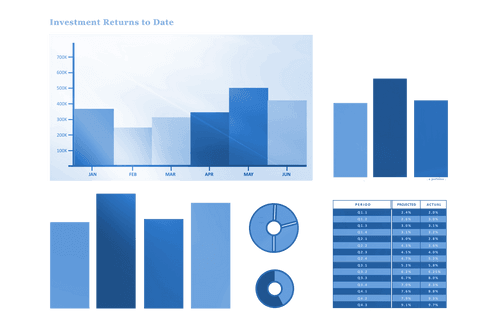
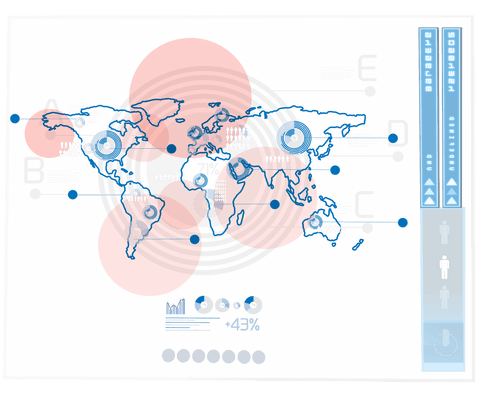
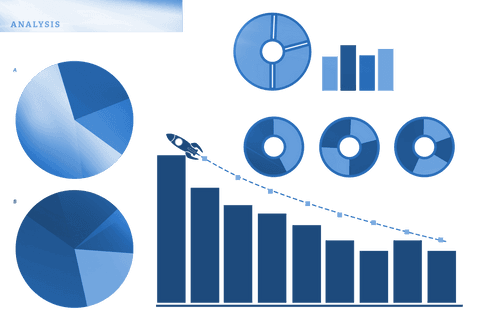
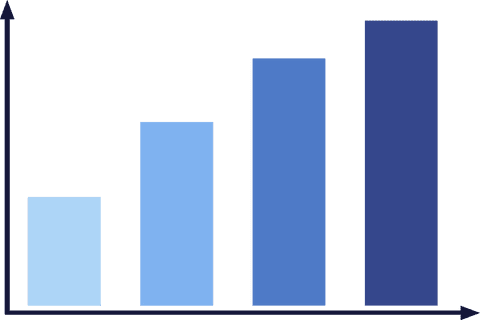
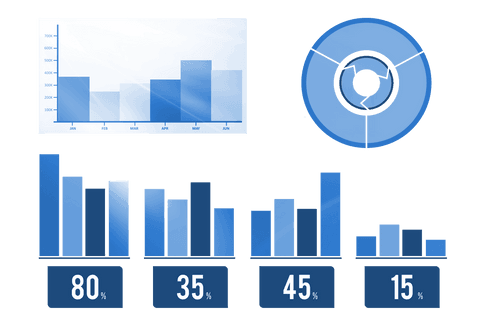
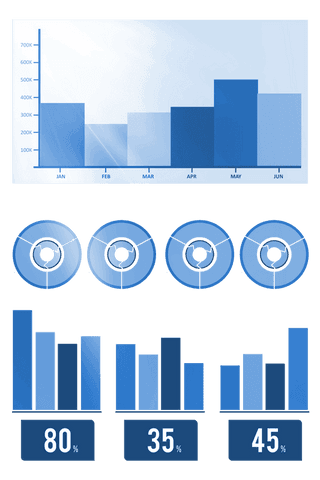
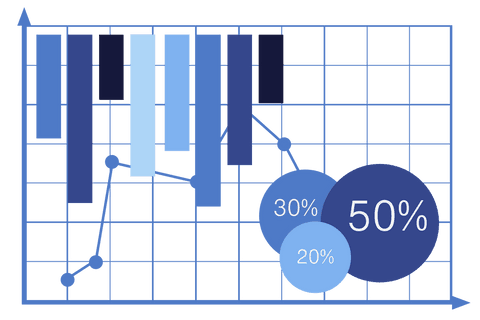
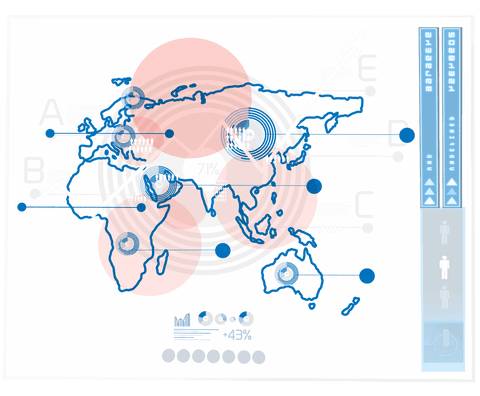
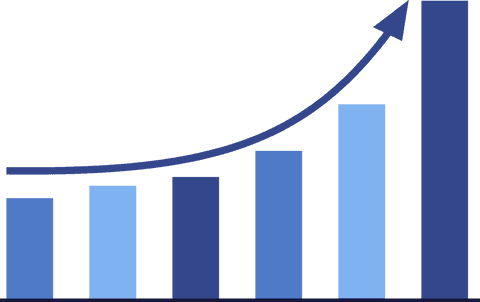
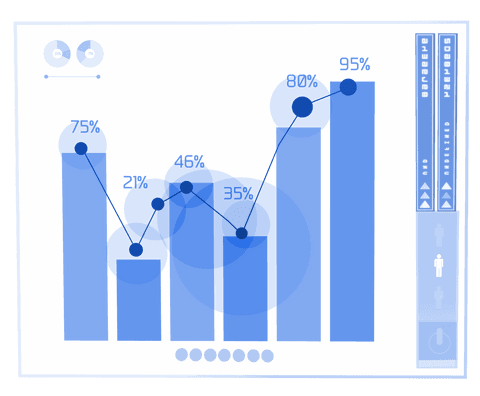
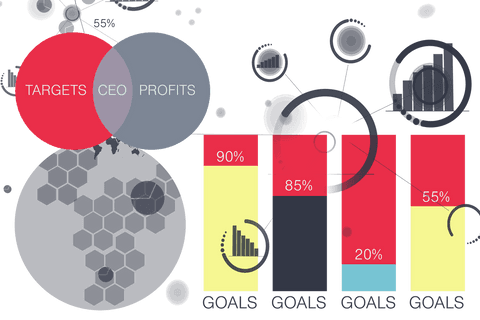
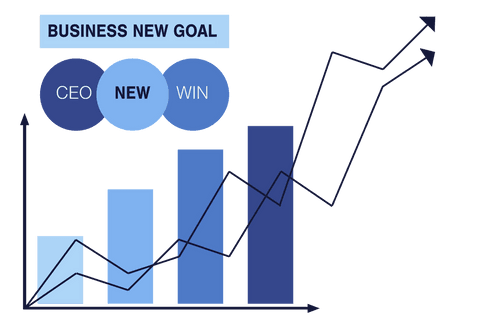
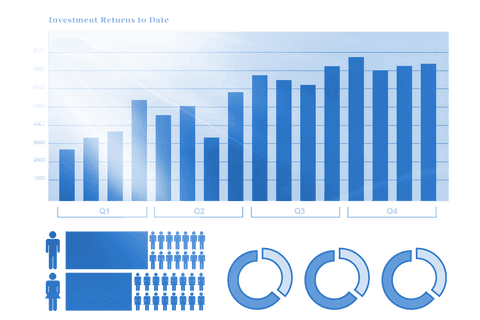
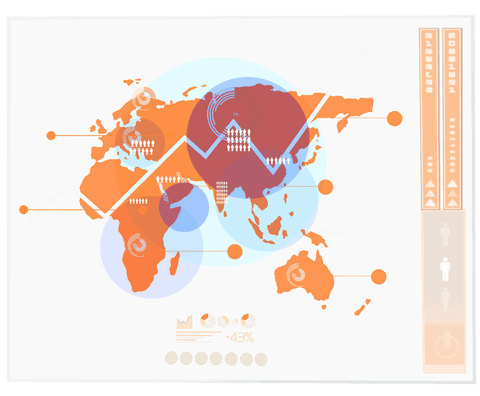
- Development Chart and Data Analysis on Transparent Background
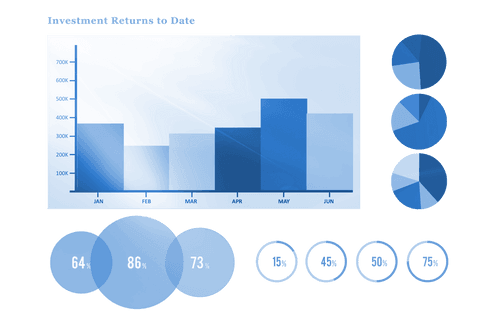
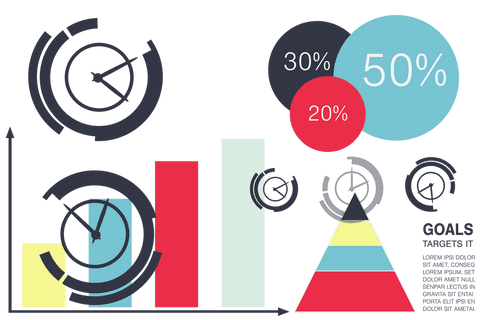
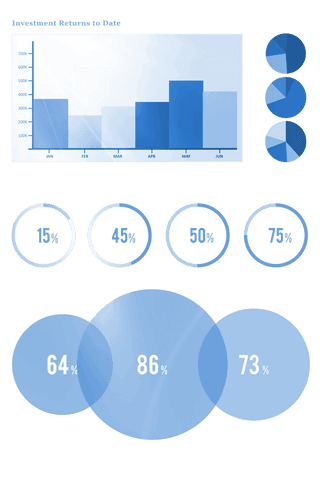
Development Chart and Data Analysis on Transparent Background PNG
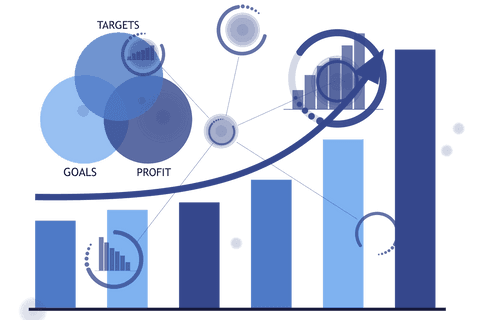
Digital illustration showing bar and line chart with interconnected circles symbolizing data analysis and development trends. Ideal for presentations about development, finance, performance tracking. Transparent background allows for versatile use in design and reports.
Powered by 


Credit Photo
If you would like to credit the Photo, here are some ways you can do so
Text Link
png Link
<span class="text-link">
<span>
<a target="_blank" href=https://pikwizard.com/png/development-chart-and-data-analysis-on-transparent-background/0314bfa180068c1017688e0e6da6d46c/>PikWizard</a>
</span>
</span>
<span class="image-link">
<span
style="margin: 0 0 20px 0; display: inline-block; vertical-align: middle; width: 100%;"
>
<a
target="_blank"
href="https://pikwizard.com/png/development-chart-and-data-analysis-on-transparent-background/0314bfa180068c1017688e0e6da6d46c/"
style="text-decoration: none; font-size: 10px; margin: 0;"
>
<img src="https://pikwizard.com/pw/medium/0314bfa180068c1017688e0e6da6d46c.png" style="margin: 0; width: 100%;" alt="" />
<p style="font-size: 12px; margin: 0;">PikWizard</p>
</a>
</span>
</span>
Free (free of charge)
Free for personal and commercial use.
Author: Creative Art
Similar Free PNG Images With Transparent Background

Premium


Premium


Premium


Premium


Premium


Premium

Premium


Premium


Premium


Premium

Premium


Premium


Premium


Premium


Premium


Premium


Premium


Premium


Premium


Premium


Premium


Premium


Premium


Premium


Premium


Explore More Free PNGs