- Home >
- Stock PNGs >
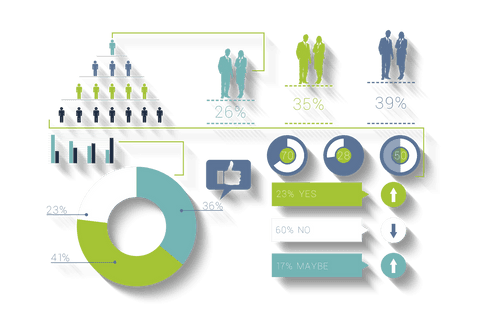
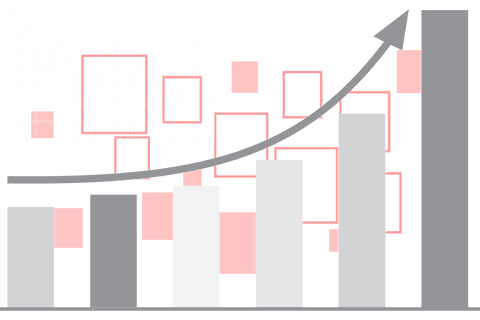
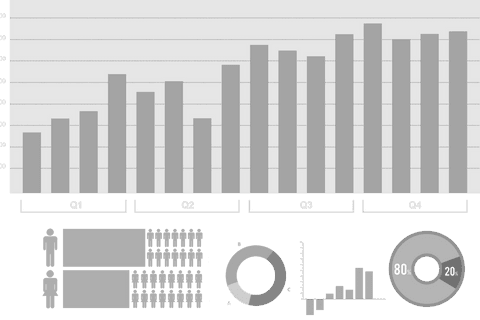
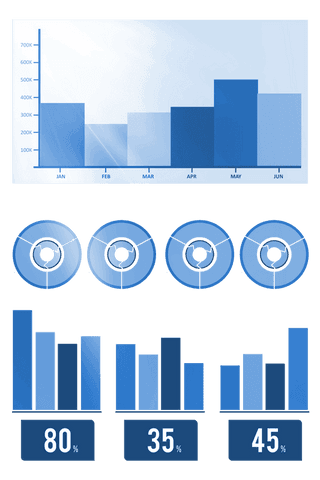
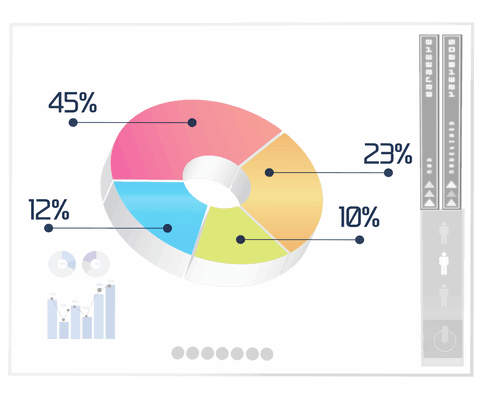
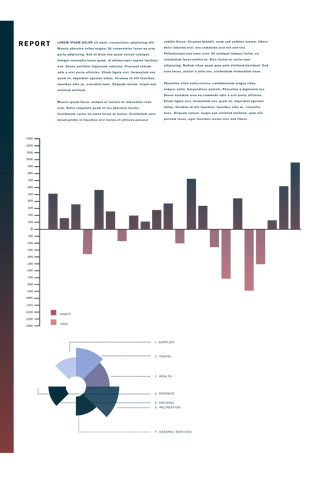
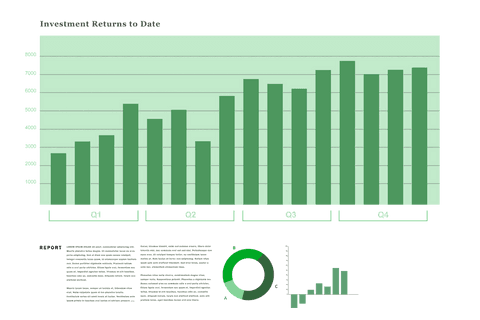
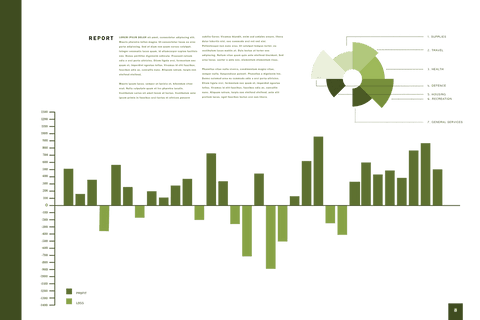
- Digital Financial Diagrams Transparent Background Vector
Digital Financial Diagrams Transparent Background Vector PNG
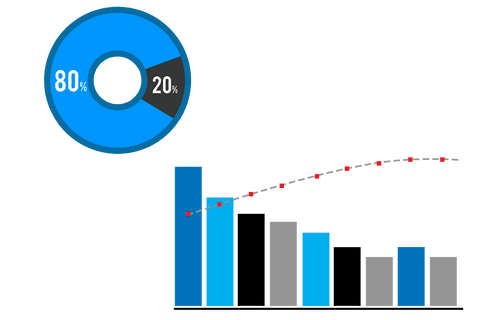
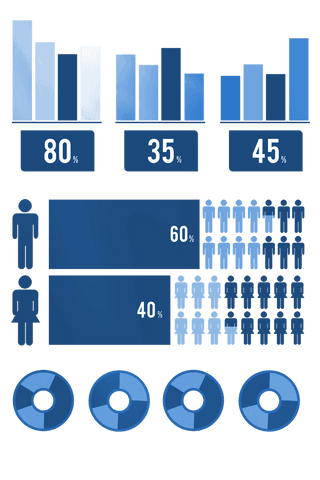
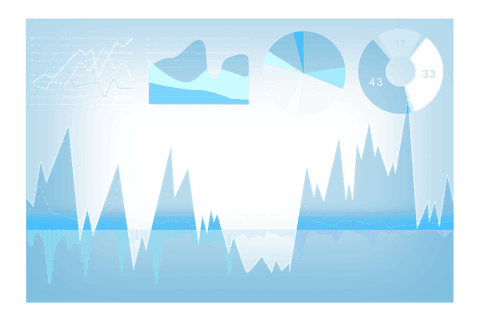
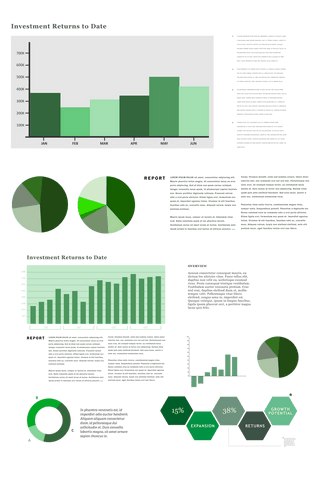
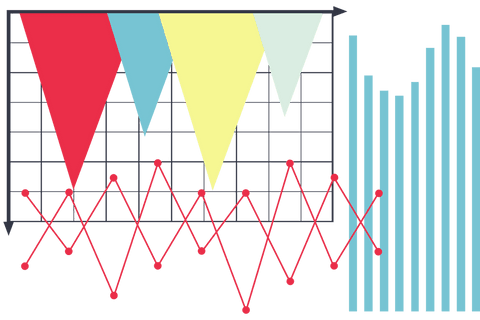
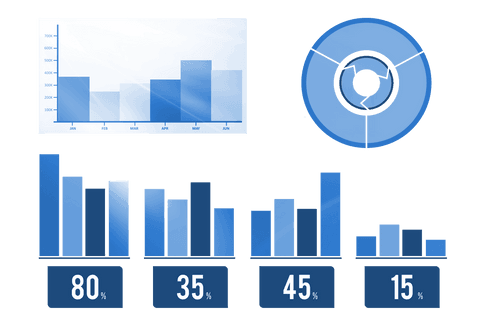
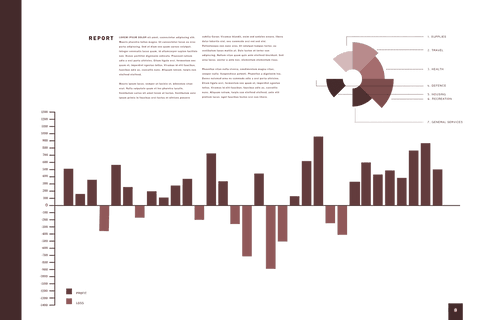
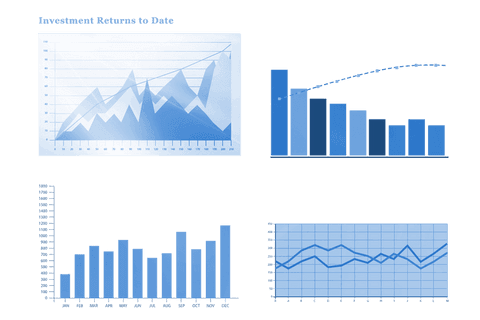
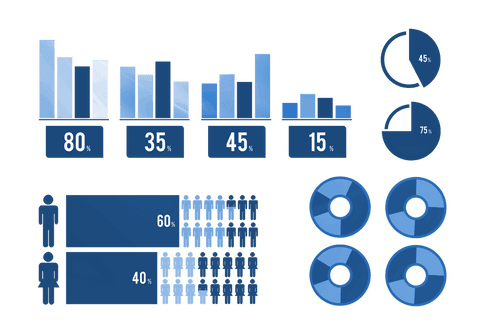
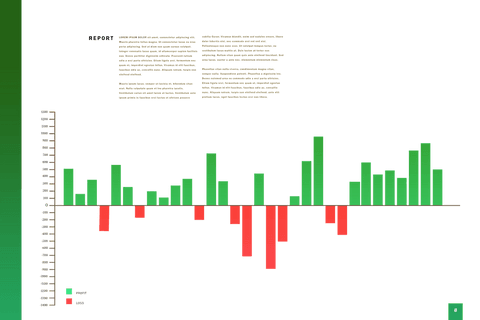
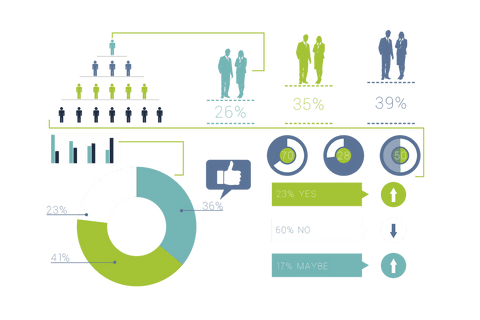
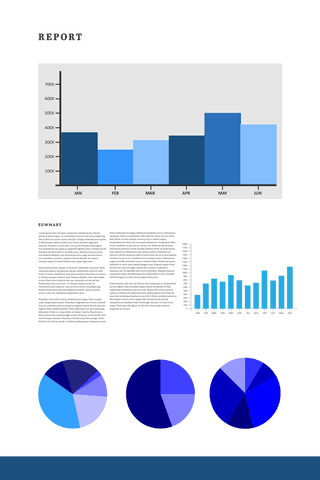
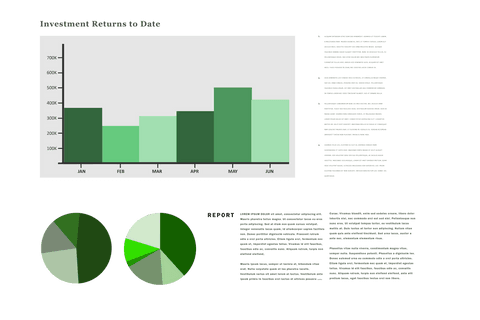
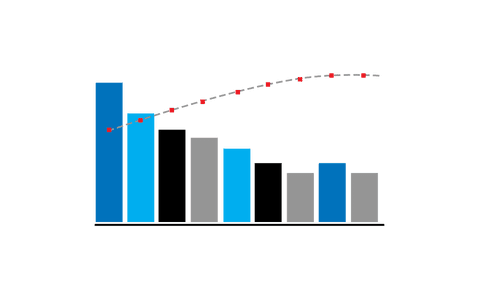
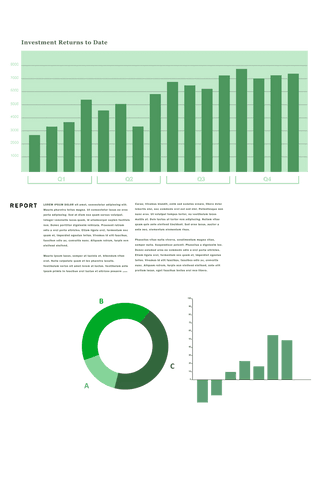
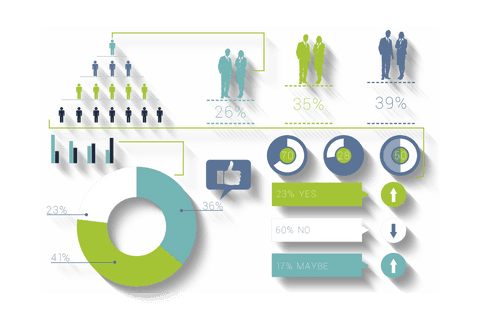
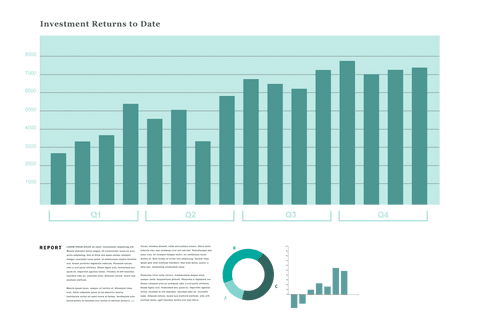
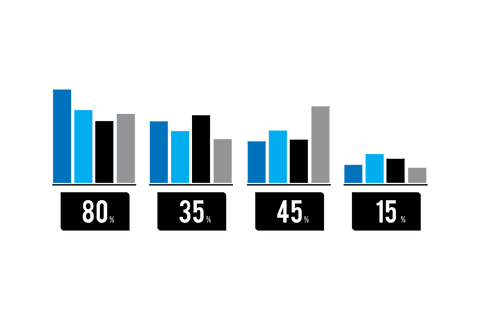
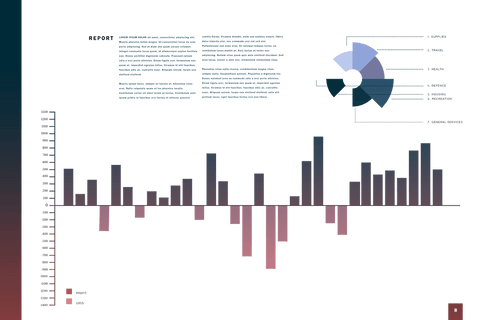
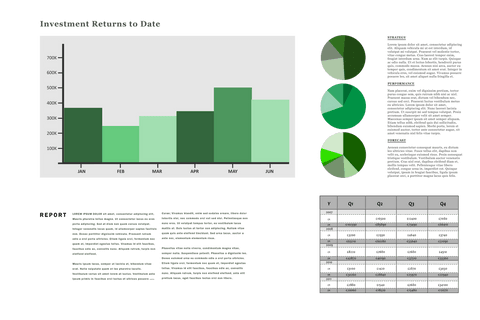
Digital illustration showing financial diagrams including pie chart, bar graph, and trend line. Translucent background made for easy integration into reports, presentations, and marketing materials related to financial data analysis, business growth, and statistical trends.

Credit Photo
If you would like to credit the Photo, here are some ways you can do so
Text Link
png Link
<span class="text-link">
<span>
<a target="_blank" href=https://pikwizard.com/png/digital-financial-diagrams-transparent-background-vector/cb52988c3db0138c84565cd78ee8bfde/>PikWizard</a>
</span>
</span>
<span class="image-link">
<span
style="margin: 0 0 20px 0; display: inline-block; vertical-align: middle; width: 100%;"
>
<a
target="_blank"
href="https://pikwizard.com/png/digital-financial-diagrams-transparent-background-vector/cb52988c3db0138c84565cd78ee8bfde/"
style="text-decoration: none; font-size: 10px; margin: 0;"
>
<img src="https://pikwizard.com/pw/medium/cb52988c3db0138c84565cd78ee8bfde.png" style="margin: 0; width: 100%;" alt="" />
<p style="font-size: 12px; margin: 0;">PikWizard</p>
</a>
</span>
</span>
Free (free of charge)
Free for personal and commercial use.
Author: Awesome Content