
- Home >
- Stock PNGs >
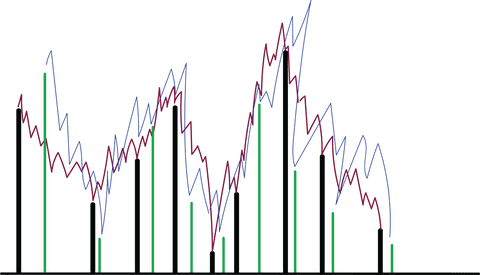
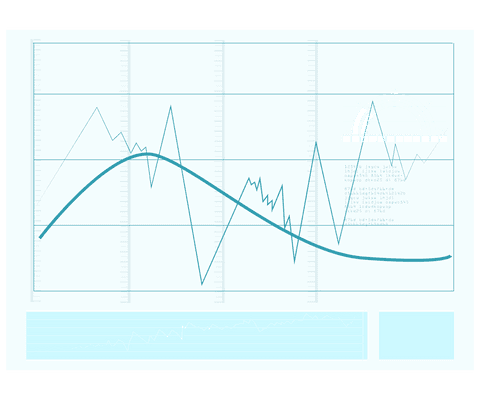
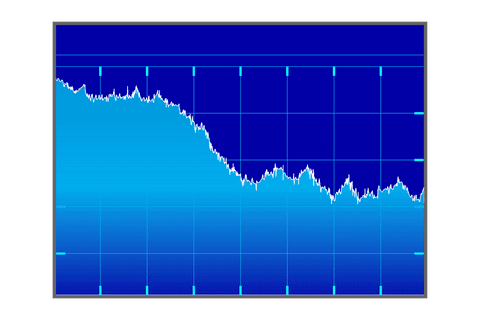
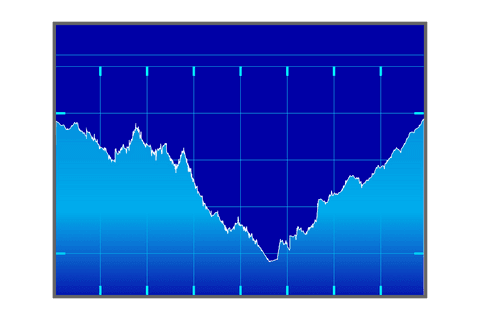
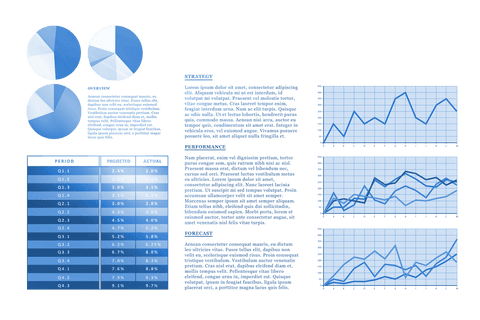
- Dynamic Business Data Analysis Graph on Transparent Background
Dynamic Business Data Analysis Graph on Transparent Background PNG
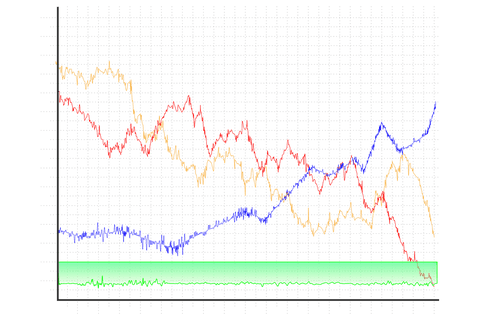
Vector illustration shows various colored lines representing complex business data trends on a transparent grid. Useful for presentations, reports, marketing materials that highlight financial analysis, corporate strategies, or data science. Compatible with diverse background designs due to transparent quality.
Powered by 


downloads
Tags:
Credit Photo
If you would like to credit the Photo, here are some ways you can do so
Text Link
png Link
<span class="text-link">
<span>
<a target="_blank" href=https://pikwizard.com/png/dynamic-business-data-analysis-graph-on-transparent-background/2f0ded8967d28cdc668c430d0aecf6bc/>PikWizard</a>
</span>
</span>
<span class="image-link">
<span
style="margin: 0 0 20px 0; display: inline-block; vertical-align: middle; width: 100%;"
>
<a
target="_blank"
href="https://pikwizard.com/png/dynamic-business-data-analysis-graph-on-transparent-background/2f0ded8967d28cdc668c430d0aecf6bc/"
style="text-decoration: none; font-size: 10px; margin: 0;"
>
<img src="https://pikwizard.com/pw/medium/2f0ded8967d28cdc668c430d0aecf6bc.png" style="margin: 0; width: 100%;" alt="" />
<p style="font-size: 12px; margin: 0;">PikWizard</p>
</a>
</span>
</span>
Free (free of charge)
Free for personal and commercial use.
Author: Authentic Images
Similar Free PNG Images With Transparent Background


Premium


Premium


Premium


Premium


Premium


Premium

Premium


Premium


Premium


Premium


Premium

Premium


Premium


Premium


Premium


Premium


Premium


Premium


Premium


Premium


Premium


Premium


Premium

Premium


Premium


Explore More Free PNGs